Panera Bread 2006 Annual Report Download - page 62
Download and view the complete annual report
Please find page 62 of the 2006 Panera Bread annual report below. You can navigate through the pages in the report by either clicking on the pages listed below, or by using the keyword search tool below to find specific information within the annual report.-
 1
1 -
2
-
3
-
4
-
5
-
6
-
7
-
8
-
9
-
10
-
11
-
12
-
13
-
14
-
15
-
16
-
17
-
18
-
19
-
20
-
21
-
22
-
23
-
24
-
25
-
26
-
27
-
28
-
29
-
30
-
31
-
32
-
33
-
34
-
35
-
36
-
37
-
38
-
39
-
40
-
41
-
42
-
43
-
44
-
45
-
46
-
47
-
48
-
49
-
50
-
51
-
 52
52 -
 53
53 -
 54
54 -
 55
55 -
 56
56 -
 57
57 -
 58
58 -
 59
59 -
 60
60 -
 61
61 -
 62
62 -
 63
63 -
 64
64 -
 65
65 -
 66
66 -
 67
67 -
 68
68 -
 69
69 -
 70
70 -
 71
71 -
 72
72 -
73
-
74
-
75
-
76
 |
 |

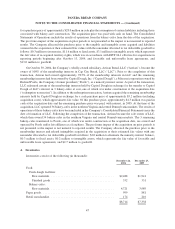
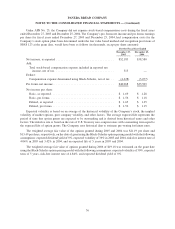
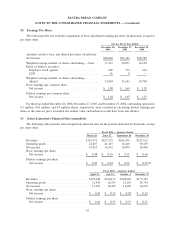
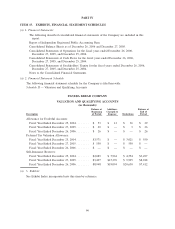
A summary of stock option activity under the Company’s stock-based compensation plans is set forth below:
Options
Weighted
Average
Exercise Price
Weighted
Average
Remaining
Contractual Term
Aggregate
Intrinsic
Value
(in thousands) (in years) (in thousands)
Outstanding at December 27, 2003 . ........ 3,081 $24.57
Granted ........................... 702 36.18
Exercised .......................... (405) 8.82
Cancelled.......................... (333) 31.02
Outstanding at December 25, 2004 . ........ 3,045 28.72
Granted ........................... 340 55.55
Exercised .......................... (657) 19.24
Cancelled.......................... (159) 36.70
Outstanding at December 27, 2005 . ........ 2,569 34.20
Granted ........................... 146 54.27
Exercised .......................... (305) 25.25
Cancelled.......................... (99) 37.74
Outstanding at December 26, 2006 . ........ 2,311 $36.36 3.2 $45,185
Exercisable at December 26, 2006 . ........ 1,152 $32.40 2.9 $26,678
Of the options at December 26, 2006, December 27, 2005, and December 25, 2004, 1,152,382, 927,972, and
1,003,723, respectively, were vested and exercisable with a weighted average exercise price of $32.40, $30.01, and
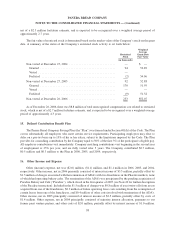
$20.85, respectively. The following table summarizes information concerning outstanding and exercisable options
at December 26, 2006:
Range of Exercise Price
Number
Outstanding
Weighted Average
Remaining
Contractual Life
Weighted
Average
Exercise Price
Number
Exercisable
Weighted
Average
Exercise Price
Options Outstanding Options Exercisable
(in thousands) (in years) (in thousands)
$ 3.19 - $26.92 ........... 238 1.9 $12.60 228 $12.02
$27.51 .................. 240 3.2 27.51 141 27.51
$28.38 - $33.22 ........... 232 2.3 29.07 131 29.01
$34.78 - $35.00 ........... 31 3.7 34.79 — 35.00
$35.29 .................. 261 3.7 35.29 56 35.29
$35.31 - $36.00 ........... 218 3.2 35.71 146 35.81
$36.15 .................. 256 2.4 36.15 112 36.15
$36.79 - $43.15 ........... 404 3.0 41.01 205 40.57
$47.95 - $54.41 ........... 335 4.7 52.02 125 54.41
$54.53 - $72.58 ........... 96 4.7 65.92 8 68.55
2,311 3.2 $36.36 1,152 $32.40
The total intrinsic value of options exercised during the fiscal years ended December 26, 2006, December 27,
2005, and December 25, 2004, was $12.3 million, $25.5 million, and $11.9 million, respectively. As of Decem-
ber 26, 2006, the total unrecognized compensation cost related to non-vested options was $11.7 million, which is
57
PANERA BREAD COMPANY
NOTES TO THE CONSOLIDATED FINANCIAL STATEMENTS — (Continued)