Panera Bread 2006 Annual Report Download - page 21
Download and view the complete annual report
Please find page 21 of the 2006 Panera Bread annual report below. You can navigate through the pages in the report by either clicking on the pages listed below, or by using the keyword search tool below to find specific information within the annual report.-
 1
1 -
2
-
3
-
4
-
5
-
6
-
7
-
8
-
9
-
10
-
 11
11 -
 12
12 -
 13
13 -
 14
14 -
 15
15 -
 16
16 -
 17
17 -
 18
18 -
 19
19 -
 20
20 -
 21
21 -
 22
22 -
 23
23 -
 24
24 -
 25
25 -
 26
26 -
 27
27 -
 28
28 -
 29
29 -
 30
30 -
 31
31 -
32
-
33
-
34
-
35
-
36
-
37
-
38
-
39
-
40
-
41
-
42
-
43
-
44
-
45
-
46
-
47
-
48
-
49
-
50
-
51
-
52
-
53
-
54
-
55
-
56
-
57
-
58
-
59
-
60
-
61
-
62
-
63
-
64
-
65
-
66
-
67
-
68
-
69
-
70
-
71
-
72
-
73
-
74
-
75
-
76
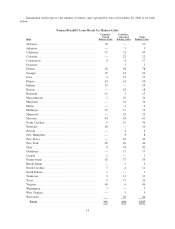
 |
 |

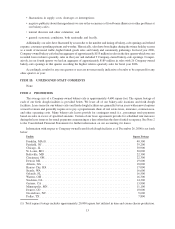
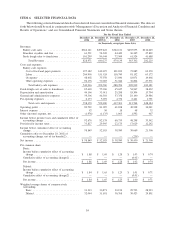
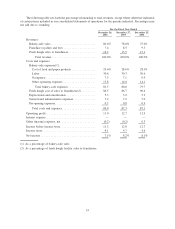
ITEM 6. SELECTED FINANCIAL DATA
The following selected financial data has been derived from our consolidated financial statements. The data set
forth below should be read in conjunction with “Management’s Discussion and Analysis of Financial Condition and
Results of Operations” and our Consolidated Financial Statements and Notes thereto.
December 26,
2006
December 27,
2005(1)
December 25,
2004
December 27,
2003
December 28,
2002
For the Fiscal Year Ended
(in thousands, except per share data)
Revenues:
Bakery-cafe sales . . . . . . . . . . . . . . . . . . . . . . . $666,141 $499,422 $362,121 $265,933 $212,645
Franchise royalties and fees . . . . . . . . . . . . . . . . 61,531 54,309 44,449 36,245 27,892
Fresh dough sales to franchisees . . . . . . . . . . . . . 101,299 86,544 72,569 61,524 41,688
Total Revenue . . . . . . . . . . . . . . . . . . . . . . 828,971 640,275 479,139 363,702 282,225
Costs and expenses:
Bakery-cafe expenses:
Cost of food and paper products . . . . . . . . . . . 197,182 142,675 101,832 73,885 63,370
Labor . . . . . . . . . . . . . . . . . . . . . . . . . . . . . . 204,956 151,524 110,790 81,152 63,172
Occupancy . . . . . . . . . . . . . . . . . . . . . . . . . . 48,602 35,558 25,040 18,071 14,668
Other operating expenses . . . . . . . . . . . . . . . . 92,176 70,003 51,044 36,804 27,971
Total bakery-cafe expenses . . . . . . . . . . . . . 542,916 399,760 288,706 209,912 169,181
Fresh dough cost of sales to franchisees . . . . . . . . . 85,618 75,036 65,627 54,967 38,432
Depreciation and amortization . . . . . . . . . . . . . . . . 44,166 33,011 25,298 18,304 13,794
General and administrative expenses . . . . . . . . . . . . 59,306 46,301 33,338 28,140 24,986
Pre-opening expenses . . . . . . . . . . . . . . . . . . . . . . 6,173 5,072 4,332 2,441 1,791
Total costs and expenses . . . . . . . . . . . . . . . 738,179 559,180 417,301 313,764 248,184
Operating profit . . . . . . . . . . . . . . . . . . . . . . . . . . 90,792 81,095 61,838 49,938 34,041
Interest expense . . . . . . . . . . . . . . . . . . . . . . . . . . 92 50 18 48 32
Other (income) expense, net . . . . . . . . . . . . . . . . . . (1,976) (1,133) 1,065 1,592 467
Income before income taxes and cumulative effect of
accounting change . . . . . . . . . . . . . . . . . . . . . . . 92,676 82,178 60,755 48,298 33,542
Provision for income taxes . . . . . . . . . . . . . . . . . . . 33,827 29,995 22,175 17,629 12,242
Income before cumulative effect of accounting
change . . . . . . . . . . . . . . . . . . . . . . . . . . . . . . . 58,849 52,183 38,580 30,669 21,300
Cumulative effect to December 28, 2002 of
accounting change, net of tax benefit(2) . . . . . . . . — — — (239) —
Net income . . . . . . . . . . . . . . . . . . . . . . . . . . . . . $ 58,849 $ 52,183 $ 38,580 $ 30,430 $ 21,300
Per common share:
Basic:
Income before cumulative effect of accounting
change . . . . . . . . . . . . . . . . . . . . . . . . . . . . . $ 1.88 $ 1.69 $ 1.28 $ 1.03 $ 0.74
Cumulative effect of accounting change(2) . . . . . . — — — (0.01) —
Net income . . . . . . . . . . . . . . . . . . . . . . . . . . . . $ 1.88 $ 1.69 $ 1.28 $ 1.02 $ 0.74
Diluted:
Income before cumulative effect of accounting
change . . . . . . . . . . . . . . . . . . . . . . . . . . . . . $ 1.84 $ 1.65 $ 1.25 $ 1.01 $ 0.71
Cumulative effect of accounting change(2) . . . . . . — — — (0.01) —
Net income . . . . . . . . . . . . . . . . . . . . . . . . . . . . $ 1.84 $ 1.65 $ 1.25 $ 1.00 $ 0.71
Weighted average shares of common stock
outstanding:
Basic . . . . . . . . . . . . . . . . . . . . . . . . . . . . . . 31,313 30,871 30,154 29,733 28,923
Diluted . . . . . . . . . . . . . . . . . . . . . . . . . . . . . 32,044 31,651 30,768 30,423 29,891
16