Panera Bread 2006 Annual Report Download - page 18
Download and view the complete annual report
Please find page 18 of the 2006 Panera Bread annual report below. You can navigate through the pages in the report by either clicking on the pages listed below, or by using the keyword search tool below to find specific information within the annual report.-
 1
1 -
2
-
3
-
4
-
5
-
6
-
7
-
 8
8 -
 9
9 -
 10
10 -
 11
11 -
 12
12 -
 13
13 -
 14
14 -
 15
15 -
 16
16 -
 17
17 -
 18
18 -
 19
19 -
 20
20 -
 21
21 -
 22
22 -
 23
23 -
 24
24 -
 25
25 -
 26
26 -
 27
27 -
 28
28 -
29
-
30
-
31
-
32
-
33
-
34
-
35
-
36
-
37
-
38
-
39
-
40
-
41
-
42
-
43
-
44
-
45
-
46
-
47
-
48
-
49
-
50
-
51
-
52
-
53
-
54
-
55
-
56
-
57
-
58
-
59
-
60
-
61
-
62
-
63
-
64
-
65
-
66
-
67
-
68
-
69
-
70
-
71
-
72
-
73
-
74
-
75
-
76
 |
 |

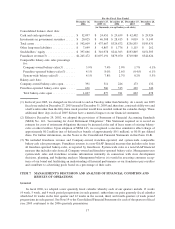
• fluctuations in supply costs, shortages or interruptions;
• negative publicity about the ingredients we use or the occurrence of food-borne illnesses or other problems at
our bakery-cafes;
• natural disasters and other calamities; and
• general economic conditions, both nationally and locally.
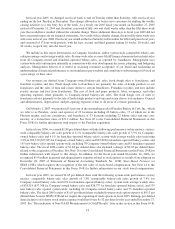
Additionally, our sales have fluctuated by season due to the number and timing of bakery-cafe openings and related
expense, consumer spending patterns and weather. Historically, sales have been higher during the winter holiday season
as a result of increased traffic, higher baked goods sales and family and community gatherings. In fiscal year 2006,
Company-owned bakery-cafes had an aggregate of approximately $155 million in sales in the first quarter which was our
recorded lowest relative quarterly sales in that year and included 9 Company-owned bakery-cafe openings. Compar-
atively, in our fourth quarter we had an aggregate of approximately $189 million in sales with 26 Company-owned
bakery-cafe openings in that quarter recording the highest relative quarterly sales for fiscal year 2006.
Accordingly, results for any one quarter or year are not necessarily indicative of results to be expected for any
other quarter or year.
ITEM 1B. UNRESOLVED STAFF COMMENTS
None.
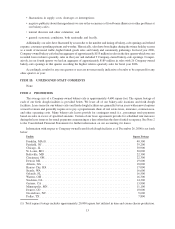
ITEM 2. PROPERTIES
The average size of a Company-owned bakery-cafe is approximately 4,600 square feet. The square footage of
each of our fresh dough facilities is provided below. We lease all of our bakery-cafe locations and fresh dough
facilities. Lease terms for our bakery-cafes and fresh dough facilities are generally for ten years with renewal options
at most locations and generally require us to pay a proportionate share of real estate taxes, insurance, common area,
and other operating costs. Many bakery-cafe leases provide for contingent rental (i.e., percentage rent) payments
based on sales in excess of specified amounts. Certain of our lease agreements provide for scheduled rent increases
during the lease terms or for rental payments commencing at a date other than the date of initial occupancy. See Note 2
to the Consolidated Financial Statements for further information on our accounting for leases.
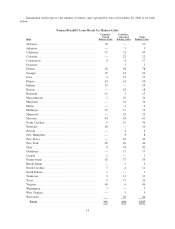
Information with respect to Company-owned leased fresh dough facilities as of December 26, 2006 is set forth
below:
Facility Square Footage
Franklin, MA(1) .................................................... 40,300
Fairfield, NJ ....................................................... 39,200
Chicago, IL ....................................................... 30,900
St. Louis, MO ..................................................... 30,000
Beltsville, MD ..................................................... 22,300
Cincinnati, OH ..................................................... 22,300
Detroit, MI........................................................ 19,600
Atlanta, GA ....................................................... 18,000
Kansas City, KS .................................................... 17,000
Seattle, WA ....................................................... 16,600
Orlando, FL ....................................................... 16,500
Warren, OH ....................................................... 16,300
Stockton, CA ...................................................... 14,300
Ontario, CA ....................................................... 13,900
Minneapolis, MN ................................................... 11,100
Denver,CO ....................................................... 10,000
Greensboro, NC .................................................... 9,600
Dallas, TX ........................................................ 7,800
(1) Total square footage includes approximately 20,000 square feet utilized in tuna and cream cheese production.
13