Nissan 2007 Annual Report Download - page 83
Download and view the complete annual report
Please find page 83 of the 2007 Nissan annual report below. You can navigate through the pages in the report by either clicking on the pages listed below, or by using the keyword search tool below to find specific information within the annual report.-
 1
1 -
2
-
3
-
4
-
5
-
6
-
7
-
8
-
9
-
10
-
11
-
12
-
13
-
14
-
15
-
16
-
17
-
18
-
19
-
20
-
21
-
22
-
23
-
24
-
25
-
26
-
27
-
28
-
29
-
30
-
31
-
32
-
33
-
34
-
35
-
36
-
37
-
38
-
39
-
40
-
41
-
42
-
43
-
44
-
45
-
46
-
47
-
48
-
49
-
50
-
51
-
52
-
53
-
54
-
55
-
56
-
57
-
58
-
59
-
60
-
61
-
62
-
63
-
64
-
65
-
66
-
67
-
68
-
69
-
70
-
71
-
72
-
 73
73 -
 74
74 -
 75
75 -
 76
76 -
 77
77 -
 78
78 -
 79
79 -
 80
80 -
 81
81 -
 82
82 -
 83
83 -
 84
84 -
 85
85 -
 86
86 -
 87
87 -
 88
88 -
 89
89 -
 90
90 -
 91
91 -
 92
92 -
 93
93
 |
 |

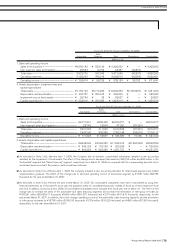
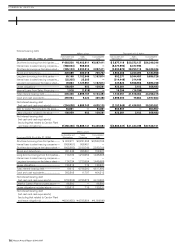
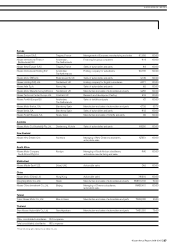
Geographical areas
The geographical segment information for the Company and its consolidated subsidiaries for the years ended March 31, 2007, 2006 and 2005
is summarized as follows:
Fiscal year 2006 (For the year ended Mar. 31, 2007)
Other foreign
Japan North America Europe countries Total Eliminations Consolidated
Millions of yen
Sales to third parties.......................................... ¥2,478,549 ¥4,550,498 ¥2,038,026 ¥1,401,510 ¥10,468,583 ¥ — ¥10,468,583
Inter-area sales and transfers .................... 2,205,469 138,945 128,388 27,528 2,500,330 (2,500,330) —
Total sales................................................................... 4,684,018 4,689,443 2,166,414 1,429,038 12,968,913 (2,500,330) 10,468,583
Operating expenses ........................................... 4,411,824 4,329,427 2,084,112 1,370,801 12,196,164 (2,504,520) 9,691,644
Operating income................................................. ¥ 272,194 ¥ 360,016 ¥ 82,302 ¥ 58,237 ¥ 772,749 ¥ 4,190 ¥ 776,939
Total assets ............................................................... ¥6,031,316 ¥6,085,485 ¥1,482,333 ¥1,070,801 ¥14,669,935 ¥(2,267,727)¥12,402,208
Thousands of U.S. dollars
Sales to third parties..........................................
$21,004,653 $38,563,542 $17,271,407 $11,877,203 $ 88,716,805 $ — $ 88,716,805
Inter-area sales and transfers ....................
18,690,415 1,177,500 1,088,034 233,288 21,189,237 (21,189,237) —
Total sales...................................................................
39,695,068 39,741,042 18,359,441 12,110,491 109,906,042 (21,189,237) 88,716,805
Operating expenses ...........................................
37,388,339 36,690,059 17,661,966 11,616,958 103,357,322 (21,224,746) 82,132,576
Operating income.................................................
$ 2,306,729 $ 3,050,983 $ 697,475 $ 493,533 $ 6,548,720 $ 35,509 $ 6,584,229
Total assets ...............................................................
$51,112,847 $51,571,907 $12,562,144 $ 9,074,585 $124,321,483 $(19,218,025)$105,103,458
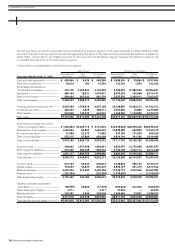
Fiscal year 2005 (For the year ended Mar. 31, 2006)
Other foreign
Japan North America Europe countries Total Eliminations Consolidated
Millions of yen
Sales to third parties.......................................... ¥2,674,549 ¥4,100,662 ¥1,414,674 ¥1,238,407 ¥ 9,428,292 ¥ — ¥ 9,428,292
Inter-area sales and transfers .................... 2,194,405 138,585 82,632 13,928 2,429,550 (2,429,550) —
Total sales................................................................... 4,868,954 4,239,247 1,497,306 1,252,335 11,857,842 (2,429,550) 9,428,292
Operating expenses ........................................... 4,478,536 3,852,304 1,430,127 1,194,714 10,955,681 (2,399,230) 8,556,451
Operating income................................................. ¥ 390,418 ¥ 386,943 ¥ 67,179 ¥ 57,621 ¥ 902,161 ¥ (30,320) ¥ 871,841
Total assets ............................................................... ¥5,961,342 ¥5,751,652 ¥ 746,016 ¥ 798,533 ¥13,257,543 ¥(1,776,117)¥11,481,426
Fiscal year 2004 (For the year ended Mar. 31, 2005)
Other foreign
Japan North America Europe countries Total Eliminations Consolidated
Millions of yen
Sales to third parties.......................................... ¥2,556,683 ¥3,726,456 ¥1,254,007 ¥1,039,131 ¥ 8,576,277 ¥ — ¥8,576,277
Inter-area sales and transfers .................... 1,981,104 81,794 51,109 7,622 2,121,629 (2,121,629) —
Total sales................................................................... 4,537,787 3,808,250 1,305,116 1,046,753 10,697,906 (2,121,629) 8,576,277
Operating expenses ........................................... 4,196,667 3,392,676 1,249,110 996,529 9,834,982 (2,119,865) 7,715,117
Operating income................................................. ¥ 341,120 ¥ 415,574 ¥ 56,006 ¥ 50,224 ¥ 862,924 ¥ (1,764) ¥ 861,160
Total assets ............................................................... ¥5,590,397 ¥4,714,272 ¥ 799,778 ¥ 637,065 ¥11,741,512 ¥(1,892,989) ¥9,848,523
Nissan Annual Report 2006-2007 81
FINANCIAL SECTION»