Nissan 2007 Annual Report Download - page 69
Download and view the complete annual report
Please find page 69 of the 2007 Nissan annual report below. You can navigate through the pages in the report by either clicking on the pages listed below, or by using the keyword search tool below to find specific information within the annual report.-
 1
1 -
2
-
3
-
4
-
5
-
6
-
7
-
8
-
9
-
10
-
11
-
12
-
13
-
14
-
15
-
16
-
17
-
18
-
19
-
20
-
21
-
22
-
23
-
24
-
25
-
26
-
27
-
28
-
29
-
30
-
31
-
32
-
33
-
34
-
35
-
36
-
37
-
38
-
39
-
40
-
41
-
42
-
43
-
44
-
45
-
46
-
47
-
48
-
49
-
50
-
51
-
52
-
53
-
54
-
55
-
56
-
57
-
58
-
 59
59 -
 60
60 -
 61
61 -
 62
62 -
 63
63 -
 64
64 -
 65
65 -
 66
66 -
 67
67 -
 68
68 -
 69
69 -
 70
70 -
 71
71 -
 72
72 -
 73
73 -
 74
74 -
 75
75 -
 76
76 -
 77
77 -
 78
78 -
 79
79 -
80
-
81
-
82
-
83
-
84
-
85
-
86
-
87
-
88
-
89
-
90
-
91
-
92
-
93
 |
 |

FINANCIAL SECTION»
Nissan Annual Report 2006-2007 67
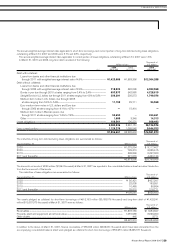
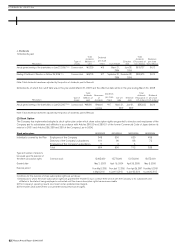
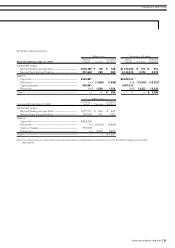
Basic net income per share is computed based on the net income available for distribution to shareholders of common stock and the weighted
average number of shares of common stock outstanding during the year, and diluted net income per share is computed based on the net income
available for distribution to the shareholders and the weighted average number of shares of common stock outstanding during each year after
giving effect to the dilutive potential of shares of common stock to be issued upon the exercise of warrants and stock subscription rights.
Net assets per share are computed based on the net assets excluding share subscription rights and minority interests (the amount of
shareholders' equity in 2005) and the number of common stock outstanding at the year end.
Cash dividends per share represent the cash dividends proposed by the Board of Directors as applicable to the respective years together with
any interim cash dividends paid.
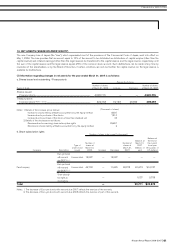
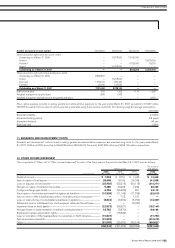
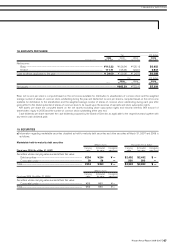
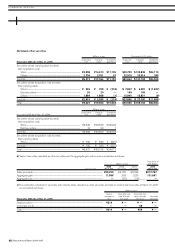
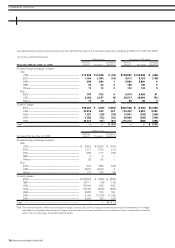
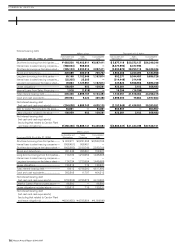
19. SECURITIES
a) Information regarding marketable securities classified as held-to-maturity debt securities and other securities at March 31, 2007 and 2006 is
as follows:
Marketable held-to-maturity debt securities
Millions of yen Thousands of U.S. dollars
Carrying Estimated Unrealized Carrying Estimated Unrealized
Fiscal year 2006 (As of Mar. 31, 2007) value fair value gain (loss) value fair value gain (loss)
Securities whose carrying value exceeds their fair value:
Debt securities............................................................................................................. ¥294 ¥294 ¥ — $2,492 $2,492 $ —
Corporate bonds......................................................................................................... 59 59 — 500 500 —
Total............................................................................................................................................... ¥353 ¥353 ¥ — $2,992 $2,992 $ —
Millions of yen
Carrying Estimated Unrealized
Fiscal year 2005 (As of Mar. 31, 2006) value fair value gain (loss)
Securities whose carrying value exceeds their fair value:
Corporate bonds......................................................................................................... ¥59 ¥59 ¥ —
Total............................................................................................................................................... ¥59 ¥59 ¥ —
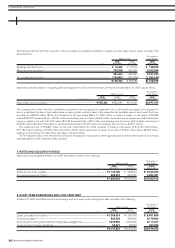
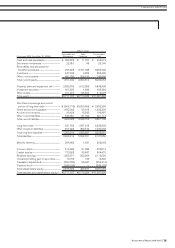
18. AMOUNTS PER SHARE
Yen U.S. dollars
2006 2005 2004 2006
For the years ended Mar. 31, 2007 Mar. 31, 2006 Mar. 31, 2005 Mar. 31, 2007
Net income:
Basic ...................................................................................................................................................................................... ¥112.33 ¥126.94 ¥125.16 $0.952
Diluted .................................................................................................................................................................................. 111.71 125.96 124.01 0.947
Cash dividends applicable to the year................................................................................................................. ¥ 34.00 ¥ 29.00 ¥ 24.00 $0.288
Yen U.S. dollars
2006 2005 2006
As of Mar. 31, 2007 Mar. 31, 2006 Mar. 31, 2007
Net assets .................................................................................................................................................................................................................. ¥862.29 ¥753.40 $7.308