Nissan 2007 Annual Report Download - page 70
Download and view the complete annual report
Please find page 70 of the 2007 Nissan annual report below. You can navigate through the pages in the report by either clicking on the pages listed below, or by using the keyword search tool below to find specific information within the annual report.-
 1
1 -
2
-
3
-
4
-
5
-
6
-
7
-
8
-
9
-
10
-
11
-
12
-
13
-
14
-
15
-
16
-
17
-
18
-
19
-
20
-
21
-
22
-
23
-
24
-
25
-
26
-
27
-
28
-
29
-
30
-
31
-
32
-
33
-
34
-
35
-
36
-
37
-
38
-
39
-
40
-
41
-
42
-
43
-
44
-
45
-
46
-
47
-
48
-
49
-
50
-
51
-
52
-
53
-
54
-
55
-
56
-
57
-
58
-
59
-
 60
60 -
 61
61 -
 62
62 -
 63
63 -
 64
64 -
 65
65 -
 66
66 -
 67
67 -
 68
68 -
 69
69 -
 70
70 -
 71
71 -
 72
72 -
 73
73 -
 74
74 -
 75
75 -
 76
76 -
 77
77 -
 78
78 -
 79
79 -
 80
80 -
81
-
82
-
83
-
84
-
85
-
86
-
87
-
88
-
89
-
90
-
91
-
92
-
93
 |
 |
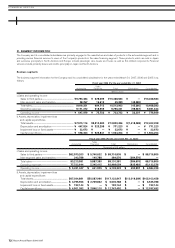
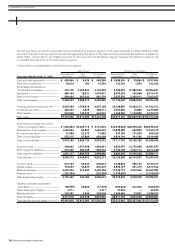
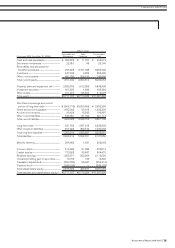
»FINANCIAL SECTION
Nissan Annual Report 2006-2007
68
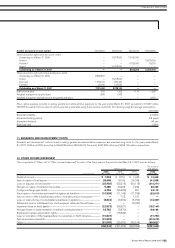
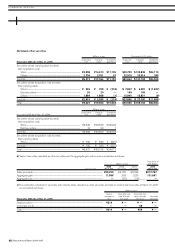
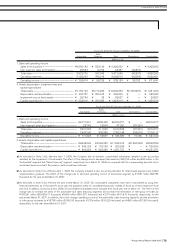
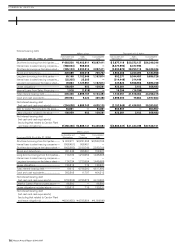
Marketable other securities
Millions of yen Thousands of U.S. dollars
Acquisition Carrying Unrealized Acquisition Carrying Unrealized
Fiscal year 2006 (As of Mar. 31, 2007) cost value gain (loss) cost value gain (loss)
Securities whose carrying value exceeds
their acquisition cost:
Stock .............................................................................................................................. ¥3,508 ¥14,613 ¥11,105 $29,729 $123,839 $94,110
Others ............................................................................................................................. 2,704 2,751 47 22,915 23,314 399
Subtotal................................................................................................................................... ¥6,212 ¥17,364 ¥11,152 $52,644 $147,153 $94,509
Securities whose acquisition cost exceeds
their carrying value:
Stock................................................................................................................................ ¥ 926 ¥ 708 ¥ (218) $ 7,847 $ 6,000 $ (1,847)
Debt securities......................................................................................................... 20 20 — 169 169 —
Others ............................................................................................................................. 1,869 1,868 (1) 15,840 15,831 (9)
Subtotal................................................................................................................................... ¥2,815 ¥ 2,596 ¥ (219) $23,856 $ 22,000 $ (1,856)
Total........................................................................................................................................... ¥9,027 ¥19,960 ¥10,933 $76,500 $169,153 $92,653
Millions of yen
Acquisition Carrying Unrealized
Fiscal year 2005 (As of Mar. 31, 2006) cost value gain (loss)
Securities whose carrying value exceeds
their acquisition cost:
Stock................................................................................................................................ ¥4,646 ¥29,549 ¥24,903
Debt securities......................................................................................................... 19 20 1
Subtotal................................................................................................................................... ¥4,665 ¥29,569 ¥24,904
Securities whose acquisition cost exceeds
their carrying value:
Stock................................................................................................................................ ¥ 766 ¥ 539 ¥ (227)
Subtotal................................................................................................................................... ¥ 766 ¥ 539 ¥ (227)
Total........................................................................................................................................... ¥5,431 ¥30,108 ¥24,677
b) Sales of securities classified as other securities and the aggregate gain and loss are summarized as follows:
Thousands of
Millions of yen U.S. dollars
2006 2005 2004 2006
For the years ended Mar. 31, 2007 Mar. 31, 2006 Mar. 31, 2005 Mar. 31, 2007
Sales proceeds....................................................................................................................................................................... ¥25,700 ¥6,156 ¥2,032 $217,797
Aggregate gain....................................................................................................................................................................... 11,996 305 1,225 101,661
Aggregate loss ....................................................................................................................................................................... —(37) (13) —
c) The redemption schedule for securities with maturity dates classified as other securities and held-to-maturity debt securities at March 31, 2007
is summarized as follows:
Millions of yen
Due in Due after one Due after five
one year or year through years through Due after
Fiscal year 2006 (As of Mar. 31, 2007) less five years ten years ten years
Debt securities........................................................................................................................................................................ ¥314 ¥ — ¥ — ¥ —
Corporate bonds ................................................................................................................................................................... —— 59—
Total................................................................................................................................................................................................. ¥314 ¥ — ¥59 ¥ —