Nissan 2007 Annual Report Download - page 13
Download and view the complete annual report
Please find page 13 of the 2007 Nissan annual report below. You can navigate through the pages in the report by either clicking on the pages listed below, or by using the keyword search tool below to find specific information within the annual report.-
 1
1 -
2
-
 3
3 -
 4
4 -
 5
5 -
 6
6 -
 7
7 -
 8
8 -
 9
9 -
 10
10 -
 11
11 -
 12
12 -
 13
13 -
 14
14 -
 15
15 -
 16
16 -
 17
17 -
 18
18 -
 19
19 -
 20
20 -
 21
21 -
 22
22 -
 23
23 -
24
-
25
-
26
-
27
-
28
-
29
-
30
-
31
-
32
-
33
-
34
-
35
-
36
-
37
-
38
-
39
-
40
-
41
-
42
-
43
-
44
-
45
-
46
-
47
-
48
-
49
-
50
-
51
-
52
-
53
-
54
-
55
-
56
-
57
-
58
-
59
-
60
-
61
-
62
-
63
-
64
-
65
-
66
-
67
-
68
-
69
-
70
-
71
-
72
-
73
-
74
-
75
-
76
-
77
-
78
-
79
-
80
-
81
-
82
-
83
-
84
-
85
-
86
-
87
-
88
-
89
-
90
-
91
-
92
-
93
 |
 |
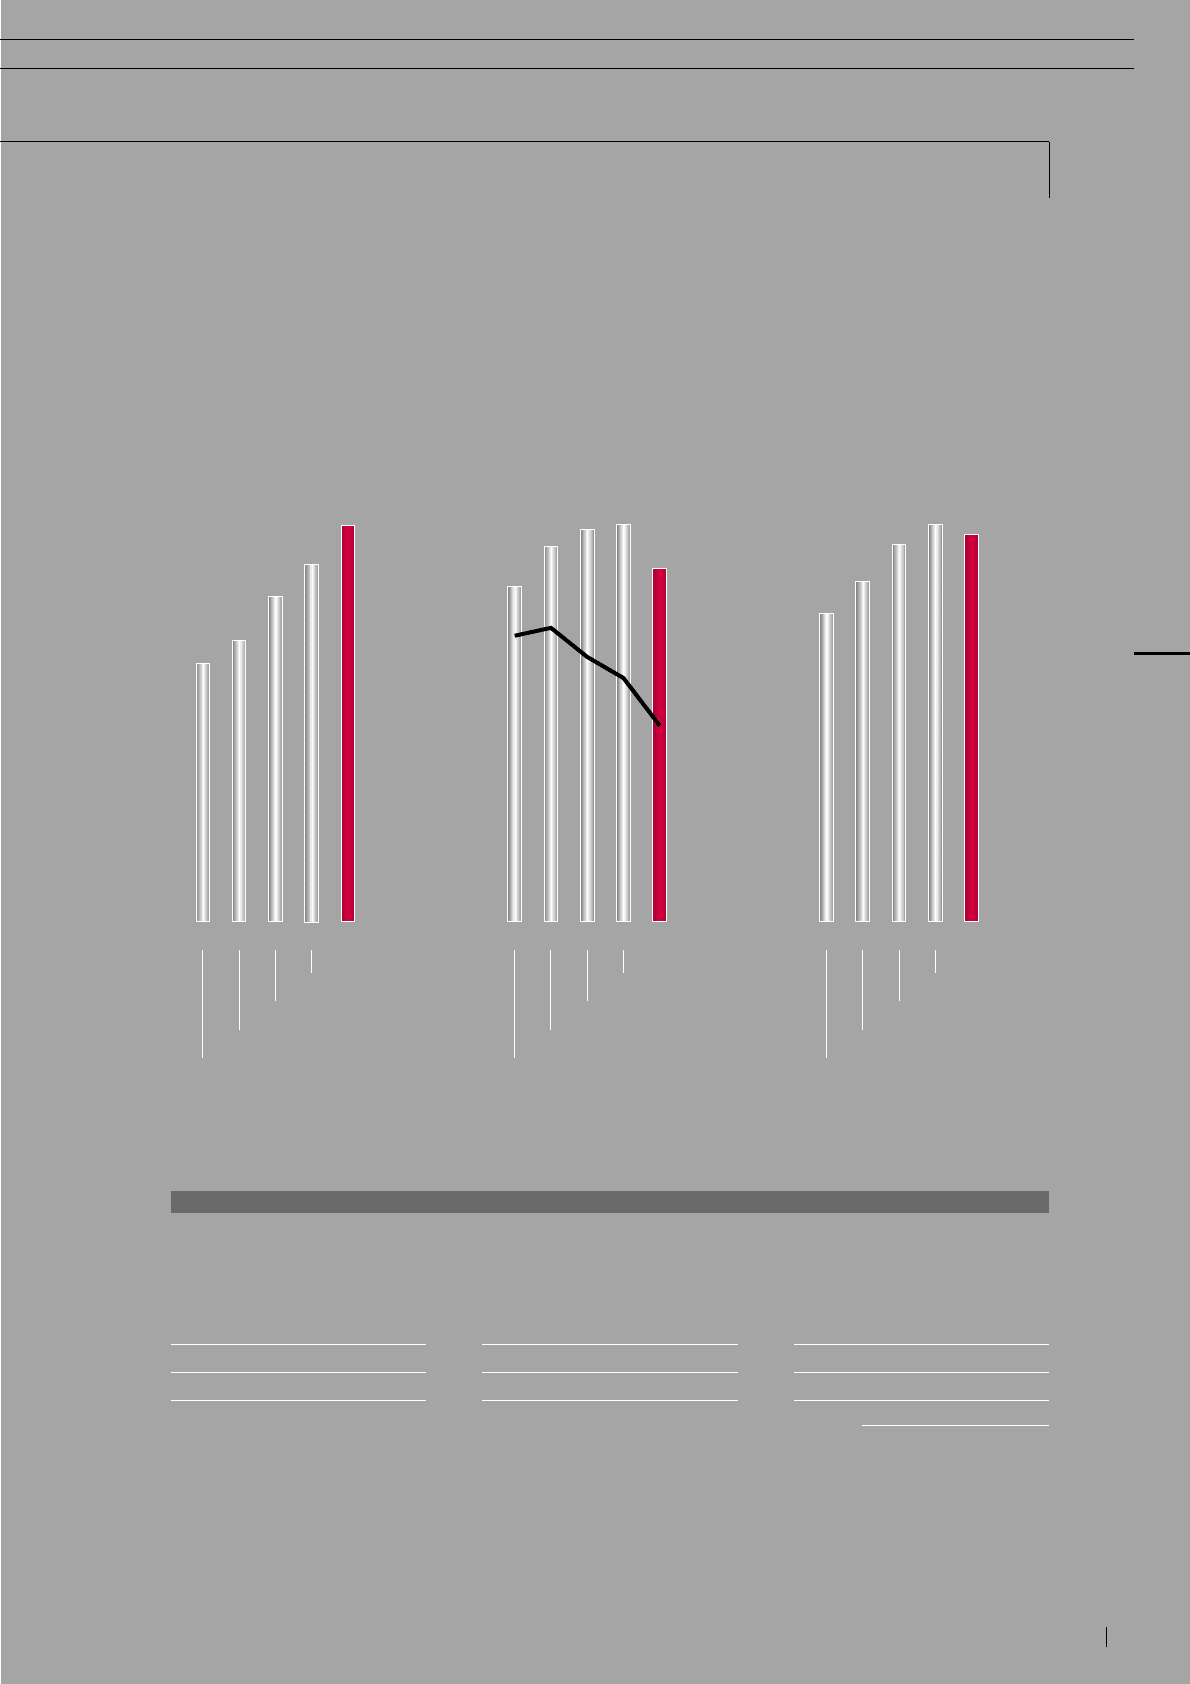
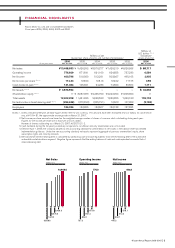
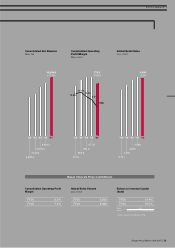
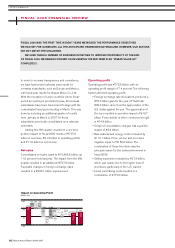
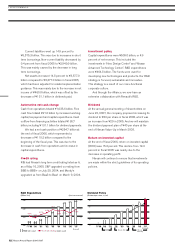
’02 ’03 ’04 ’05 ’06
6,828.6
7,429.2
8,576.3
9,428.3
10,468.6
+11.0%
’02 ’03 ’04 ’05 ’06
737.2
824.9
861.2
871.8
776.9
-10.9%
’02 ’03 ’04 ’05 ’06
2,771
3,057
3,389
3,569
3,483
-2.4%
7.4%
11.1%
10.0%
9.2%
10.8%
Nissan Annual Report 2006-2007 11
Consolidated Net Revenue
(Billion Yen)
Consolidated Operating
Profit/Margin
(Billion Yen/%)
Global Retail Sales
(Units: 1000s)
Consolidated Operating Profit
Margin
FY05 9.2%
FY06 7.4%
FY05 19.4%
FY06 15.3%
ROIC =COP
(auto) [Fixed assets + net working capital]
* Same scope of consolidation as P&L
Return on Invested Capital
(Auto)
FY05 3,569
FY06 3,483
Global Sales Volume
(Units: 1000s)
PERFORMANCE »
Nissan Value-Up Three Commitments