Nissan 2007 Annual Report Download - page 18
Download and view the complete annual report
Please find page 18 of the 2007 Nissan annual report below. You can navigate through the pages in the report by either clicking on the pages listed below, or by using the keyword search tool below to find specific information within the annual report.-
 1
1 -
2
-
3
-
4
-
5
-
6
-
7
-
 8
8 -
 9
9 -
 10
10 -
 11
11 -
 12
12 -
 13
13 -
 14
14 -
 15
15 -
 16
16 -
 17
17 -
 18
18 -
 19
19 -
 20
20 -
 21
21 -
 22
22 -
 23
23 -
 24
24 -
 25
25 -
 26
26 -
 27
27 -
 28
28 -
29
-
30
-
31
-
32
-
33
-
34
-
35
-
36
-
37
-
38
-
39
-
40
-
41
-
42
-
43
-
44
-
45
-
46
-
47
-
48
-
49
-
50
-
51
-
52
-
53
-
54
-
55
-
56
-
57
-
58
-
59
-
60
-
61
-
62
-
63
-
64
-
65
-
66
-
67
-
68
-
69
-
70
-
71
-
72
-
73
-
74
-
75
-
76
-
77
-
78
-
79
-
80
-
81
-
82
-
83
-
84
-
85
-
86
-
87
-
88
-
89
-
90
-
91
-
92
-
93
 |
 |

Nissan Annual Report 2006-2007
16
1,000
850
700
550
FY05
O.P.
FY06
w/Q5
O.P.
Scope
of con-
solida-
tion
Price/
Volume
mix
Selling
expenses
(Incl.
incentives)
Pur-
chasing
cost
reduc-
tion
Product
enrichment
and
regulatory
costs
R&D
expenses
Manu-
facturing
expenses
Warranty
expenses
G&A
others
871.8
FY06
12
months
O.P.
755.5
+8.4
–156.3
–21.8
+170.0
Raw
material/
Energy
cost
–110.1
–66.3 –1.4 –4.9 +1.9
–6.6 776.9
Q5
Effect
+21.4
FOREX
+70.8
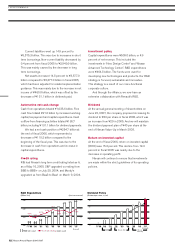
Impact on Operating Profit
(Billion Yen)
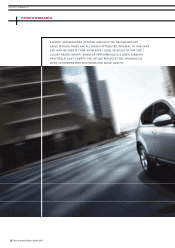
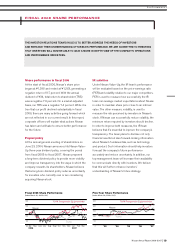
FISCAL 2006 WAS THE FIRST TIME IN EIGHT YEARS WE MISSED THE PERFORMANCE OBJECTIVES
WE HAD SET FOR OURSELVES. ALL THE ANTICIPATED HEADWINDS MATERIALIZED. HOWEVER, OUR ACTIONS
DID NOT MATCH THE CHALLENGE.
WE HAVE TAKEN A NUMBER OF BUSINESS INITIATIVES TO IMPROVE PROFITABILITY AT THE END
OF FISCAL 2006. WE REMAIN FOCUSED ON DELIVERING THE MID-TERM PLAN “NISSAN VALUE-UP”
COMPLETELY.
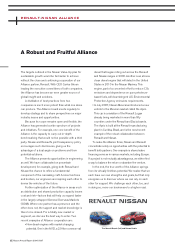
In order to increase transparency and consistency,
we have harmonized calendar year results for
overseas subsidiaries, such as Europe and Mexico,
with fiscal year results for Nissan Motor Co., Ltd.
With the exception of some countries where fiscal-
period accounting is precluded by law, all overseas
subsidiaries have been harmonized to align with the
consolidated fiscal period ending in March. This was
done by including an additional quarter of results
from January to March in 2007 for those
subsidiaries previously consolidated on a calendar
year basis.
Adding this fifth quarter resulted in a one time
positive impact to fiscal 2006 results of ¥767.6
billion in revenues, ¥21.4 billion in operating profits
and ¥11.6 billion in net income.
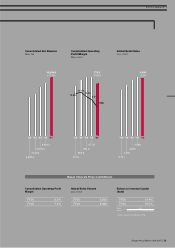
Net sales
Consolidated net sales came to ¥10,468.6 billion, up
11.0 percent from last year. The impact from the fifth
quarter resulted in an additional ¥767.6 billion.
Favorable changes in foreign exchange rates
resulted in a ¥326.1 billion improvement.
Operating profit
Operating profit was ¥776.9 billion, with an
operating profit margin of 7.4 percent. The following
factors affected operating profit:
• Foreign exchange rate fluctuations produced a
¥70.8 billion gain for the year. Of that total,
¥39.2 billion came from the appreciation of the
U.S. dollar against the yen. The appreciation of
the euro resulted in a positive impact of ¥16.7
billion. Forex activity in other currencies brought
in ¥14.9 billion.
• Scope of consolidation changes had a positive
impact of ¥8.4 billion.
• Raw material and energy costs increased by
¥110.1 billion. Price, volume and mix had a
negative impact of ¥156.3 billion. The
combination of these two items was the
principal reason for the underachievement in
fiscal 2006.
• Selling expenses increased by ¥21.8 billion,
which was mainly due to the higher level of
incentives, particularly in the U.S. market.
• Lower purchasing costs resulted in a
contribution of ¥170.0 billion.
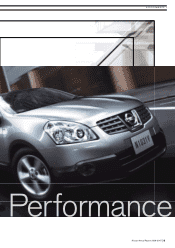
FISCAL 2006 FINANCIAL REVIEW
»PERFORMANCE