Nissan 2007 Annual Report Download - page 75
Download and view the complete annual report
Please find page 75 of the 2007 Nissan annual report below. You can navigate through the pages in the report by either clicking on the pages listed below, or by using the keyword search tool below to find specific information within the annual report.-
 1
1 -
2
-
3
-
4
-
5
-
6
-
7
-
8
-
9
-
10
-
11
-
12
-
13
-
14
-
15
-
16
-
17
-
18
-
19
-
20
-
21
-
22
-
23
-
24
-
25
-
26
-
27
-
28
-
29
-
30
-
31
-
32
-
33
-
34
-
35
-
36
-
37
-
38
-
39
-
40
-
41
-
42
-
43
-
44
-
45
-
46
-
47
-
48
-
49
-
50
-
51
-
52
-
53
-
54
-
55
-
56
-
57
-
58
-
59
-
60
-
61
-
62
-
63
-
64
-
 65
65 -
 66
66 -
 67
67 -
 68
68 -
 69
69 -
 70
70 -
 71
71 -
 72
72 -
 73
73 -
 74
74 -
 75
75 -
 76
76 -
 77
77 -
 78
78 -
 79
79 -
 80
80 -
 81
81 -
 82
82 -
 83
83 -
 84
84 -
 85
85 -
86
-
87
-
88
-
89
-
90
-
91
-
92
-
93
 |
 |
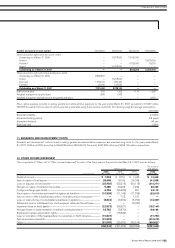
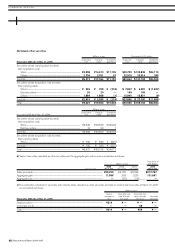
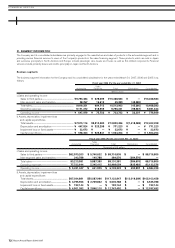
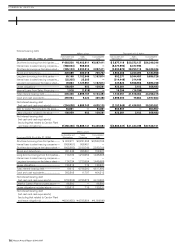
Fiscal year 2005 (For the year ended Mar. 31, 2006)
Sales
Automobile Financing Total Eliminations Consolidated
Millions of yen
I. Sales and operating income
Sales to third parties........................................................................... ¥8,895,143 ¥ 533,149 ¥ 9,428,292 ¥ — ¥ 9,428,292
Inter-segment sales and transfers........................................... 28,563 14,794 43,357 (43,357) —
Total sales.................................................................................................... 8,923,706 547,943 9,471,649 (43,357) 9,428,292
Operating expenses............................................................................ 8,160,292 478,218 8,638,510 (82,059) 8,556,451
Operating income.................................................................................. ¥ 763,414 ¥ 69,725 ¥ 833,139 ¥ 38,702 ¥ 871,841
II. Assets, depreciation, impairment loss and
capital expenditures
Total assets ................................................................................................ ¥7,152,144 ¥5,710,239 ¥12,862,383 ¥(1,380,957) ¥11,481,426
Depreciation and amortization.................................................... ¥ 400,787 ¥ 254,615 ¥ 655,402 ¥ — ¥ 655,402
Impairment loss on fixed assets................................................ ¥ 26,794 ¥ 33 ¥ 26,827 ¥ — ¥ 26,827
Capital expenditures........................................................................... ¥ 503,916 ¥ 920,398 ¥ 1,424,314 ¥ — ¥ 1,424,314
Fiscal year 2004 (For the year ended Mar. 31, 2005)
Sales
Automobile Financing Total Eliminations Consolidated
Millions of yen
I. Sales and operating income
Sales to third parties................................................................................... ¥8,177,841 ¥398,436 ¥8,576,277 ¥ — ¥8,576,277
Inter-segment sales and transfers................................................... 23,742 13,509 37,251 (37,251) —
Total sales............................................................................................................ 8,201,583 411,945 8,613,528 (37,251) 8,576,277
Operating expenses.................................................................................... 7,429,760 338,388 7,768,148 (53,031) 7,715,117
Operating income.......................................................................................... ¥ 771,823 ¥ 73,557 ¥ 845,380 ¥ 15,780 ¥ 861,160
II. Assets, depreciation and capital expenditures
Total assets ........................................................................................................ ¥6,646,594 ¥4,596,322 ¥11,242,916 ¥(1,394,393) ¥9,848,523
Depreciation and amortization............................................................ ¥ 349,163 ¥ 176,763 ¥ 525,926 ¥ — ¥ 525,926
Capital expenditures................................................................................... ¥ 469,283 ¥ 582,468 ¥ 1,051,751 ¥ — ¥1,051,751
Nissan Annual Report 2006-2007 73
FINANCIAL SECTION»
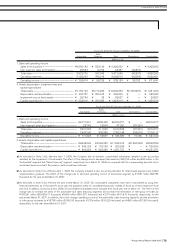
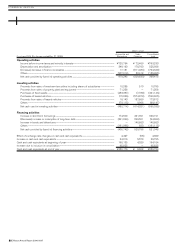
a) As described in Note 2 (b), effective April 1, 2005, the Company and its domestic consolidated subsidiaries adopted a new accounting
standard for the impairment of fixed assets. The effect of this change was to decrease total assets by ¥26,794 million and ¥33 million in the
“Automobile” segment and “Sales Financing” segment, respectively, as of March 31, 2006 as compared with the corresponding amounts which
would have been recorded if the previous method had been followed.
b) As described in Note 2 (c), effective April 1, 2006, the Company adopted a new accounting standard for share-based payment and related
implementation guidance. The effect of this change was to decrease operating income of automobile segment by ¥1,037 million ($8,788
thousand) for the year ended March 31, 2007.
c) As described in Note 2 (e), effective the year ended March 31, 2007, 22 consolidated subsidiaries have been consolidated by using their
financial statements as of the parent's fiscal year end prepared solely for consolidated purposes instead of those as of their respective fiscal
year end. In addition, during fiscal year 2006, 33 consolidated subsidiaries have changed their fiscal year end to March 31. The effect of this
change was to increase net sales of the automobile and sales financing segments and increase the elimination of inter-group net sales by
¥759,391 million ($6,435,517 thousand), ¥9,586 million ($81,237 thousand) and ¥1,371million ($11,618 thousand), respectively, for the
year ended March 31, 2007. In addition, due to this change, operating income of the automobile, sales financing segments and the elimination
of inter-group increased by ¥18,785 million ($159,195 thousand), ¥1,796 million ($15,220 thousand) and ¥862 million ($7,305 thousand),
respectively, for the year ended March 31, 2007.