Nissan 2007 Annual Report Download - page 21
Download and view the complete annual report
Please find page 21 of the 2007 Nissan annual report below. You can navigate through the pages in the report by either clicking on the pages listed below, or by using the keyword search tool below to find specific information within the annual report.-
 1
1 -
2
-
3
-
4
-
5
-
6
-
7
-
8
-
9
-
10
-
 11
11 -
 12
12 -
 13
13 -
 14
14 -
 15
15 -
 16
16 -
 17
17 -
 18
18 -
 19
19 -
 20
20 -
 21
21 -
 22
22 -
 23
23 -
 24
24 -
 25
25 -
 26
26 -
 27
27 -
 28
28 -
 29
29 -
 30
30 -
 31
31 -
32
-
33
-
34
-
35
-
36
-
37
-
38
-
39
-
40
-
41
-
42
-
43
-
44
-
45
-
46
-
47
-
48
-
49
-
50
-
51
-
52
-
53
-
54
-
55
-
56
-
57
-
58
-
59
-
60
-
61
-
62
-
63
-
64
-
65
-
66
-
67
-
68
-
69
-
70
-
71
-
72
-
73
-
74
-
75
-
76
-
77
-
78
-
79
-
80
-
81
-
82
-
83
-
84
-
85
-
86
-
87
-
88
-
89
-
90
-
91
-
92
-
93
 |
 |
Nissan Annual Report 2006-2007 19
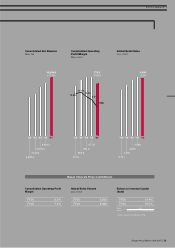
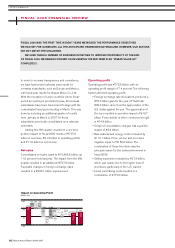
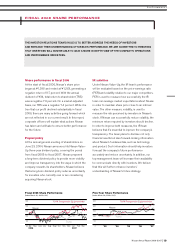
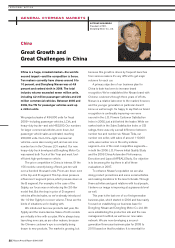
Share performance in fiscal 2006
At the start of fiscal 2006, Nissan’s share price
began at ¥1,398 and ended at ¥1,263, generating a
negative return of 9.7 percent. With the annual
dividend of ¥34, total return to shareholder (TRS)
was a negative 7.2 percent. On a market-adjusted
basis, our TRS was a negative 7.4 percent. While it is
true that our profit declined substantially in fiscal
2006, there are many activities going forward which
are not reflected in our current result. In this report,
corporate officers will explain what actions Nissan
has taken and will take to ensure better performance
for the future.
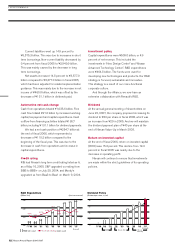
Payout policy
At the annual general meeting of shareholders on
June 23, 2004, Nissan announced its Nissan Value-
Up three-year dividend policy, covering the period
from fiscal 2005 to fiscal 2007. Nissan proposed
a long-term dividend policy to provide more visibility
and improve transparency into the ways in which the
company rewards its shareholders. Nissan believes
that a long-term dividend policy reduces uncertainty
for investors who currently own or are considering
acquiring Nissan stock.
IR activities
Under Nissan Value-Up, the IR team’s performance
will be evaluated based on the price-earnings ratio
(PER) and volatility relative to our major competitors.
PER is used to measure how successfully the IR
team can manage market expectations about Nissan
in order to maintain share price close to an intrinsic
value. The other measure, volatility, is used to
measure the risk perceived by investors in Nissan’s
stock. If Nissan can successfully reduce volatility, the
minimum return required by investors should decline.
In order to improve both measures, the IR team
believes that it’s essential to improve the company’s
transparency. The team plans to disclose not only
financial results but also forward-looking information
about Nissan’s fundamentals, such as technology
and product. Such information should help investors
forecast the company’s future performance
accurately and reduce uncertainty. In addition, our
top management team will increase their availability
to communicate directly with investors. We believe
that this will further enhance investors’
understanding of Nissan’s future strategy.
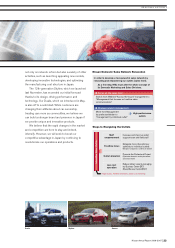
FISCAL 2006 SHARE PERFORMANCE
THE INVESTOR RELATIONS TEAM’S ROLE IS TO BETTER ADDRESS THE NEEDS OF INVESTORS
AND ENHANCE THEIR UNDERSTANDING OF NISSAN’S PERFORMANCE. WE ARE COMMITTED TO ENSURING
THAT INVESTORS WILL NOW BE ABLE TO GAIN A MORE IN-DEPTH VIEW OF THE COMPANY’S OPERATIONS
AND PERFORMANCE INDICATORS.
130
120
110
100
90
80
0.8
1.3
TOPIX Transportation Equipment Index
TOPIX
Nissan
Apr.
2006 2007
May June July Aug. Sept. Oct. Nov. Dec. Jan. Feb. Mar.
Fiscal 2006 Share Performance
(Index: March 31, 2006=100)
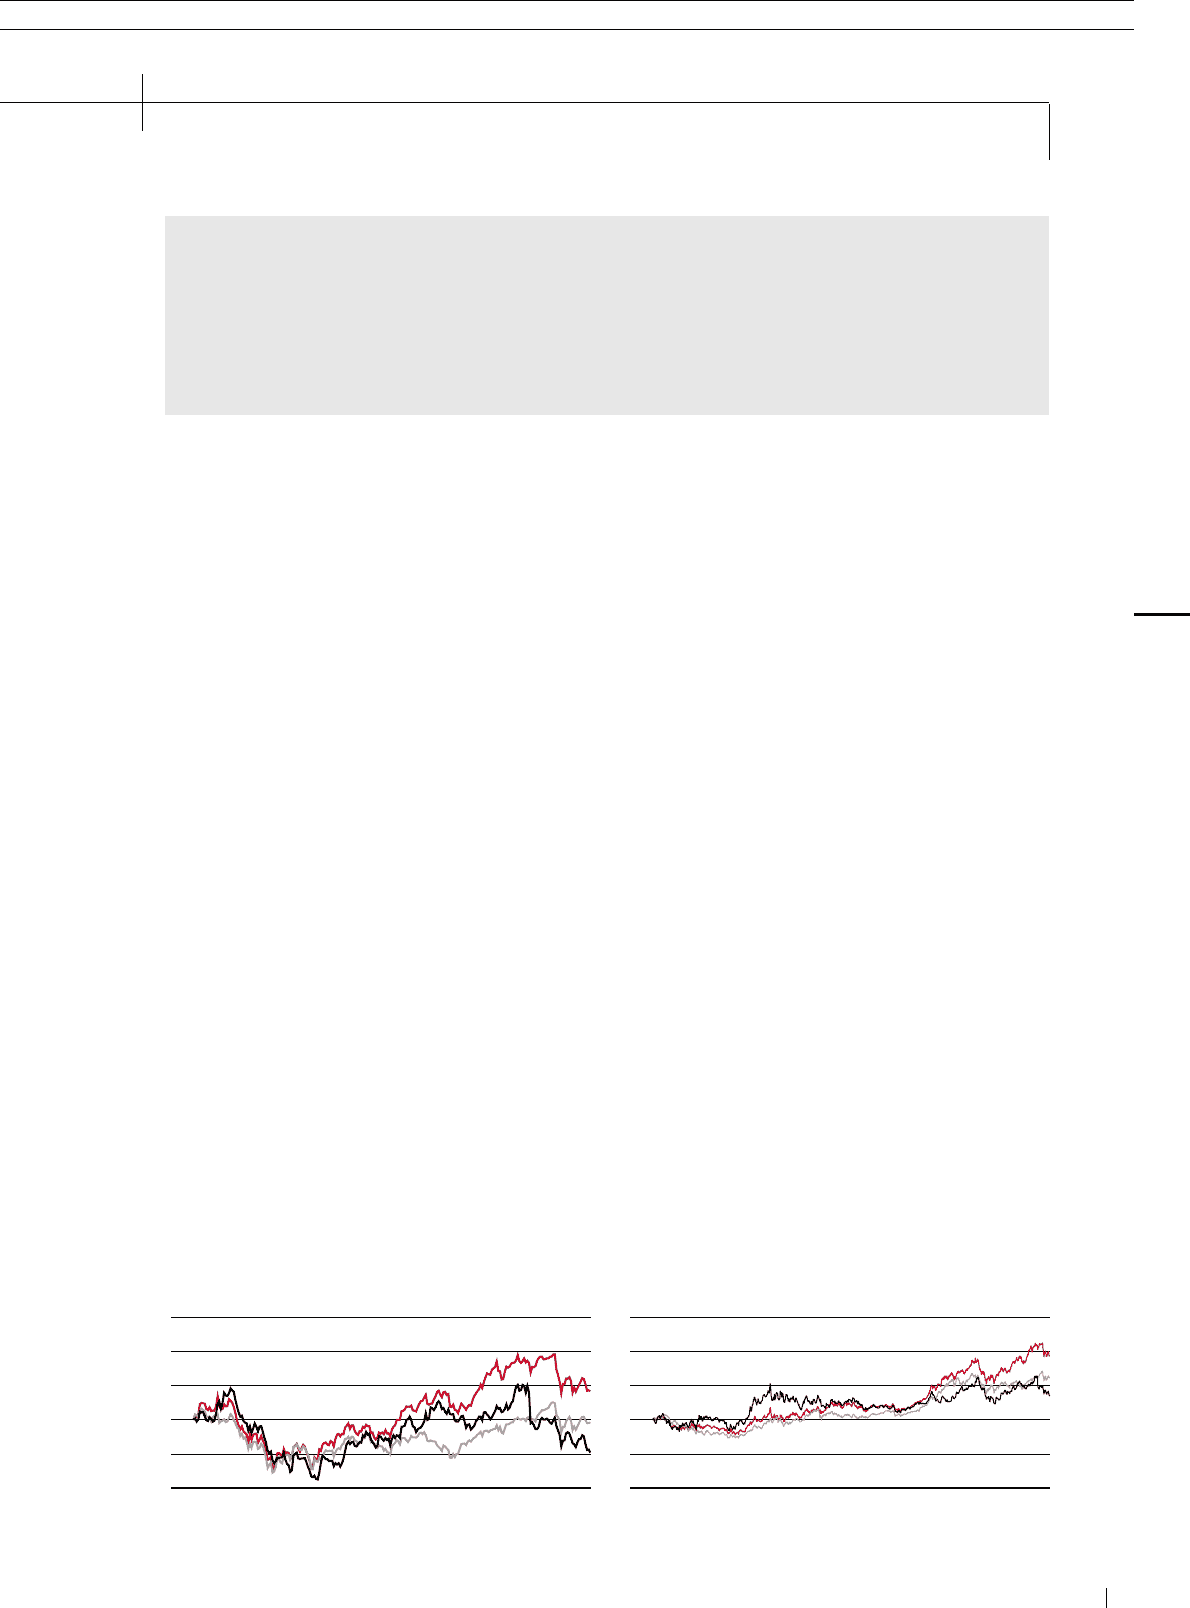
250
200
150
100
50
0
’03 ’04 ’05 ’06 ’07
TOPIX Transportation Equipment Index
TOPIX
Nissan
Five-Year Share Performance
(Index: March 29, 2002=100)
PERFORMANCE»