Nissan 2007 Annual Report Download - page 56
Download and view the complete annual report
Please find page 56 of the 2007 Nissan annual report below. You can navigate through the pages in the report by either clicking on the pages listed below, or by using the keyword search tool below to find specific information within the annual report.-
 1
1 -
2
-
3
-
4
-
5
-
6
-
7
-
8
-
9
-
10
-
11
-
12
-
13
-
14
-
15
-
16
-
17
-
18
-
19
-
20
-
21
-
22
-
23
-
24
-
25
-
26
-
27
-
28
-
29
-
30
-
31
-
32
-
33
-
34
-
35
-
36
-
37
-
38
-
39
-
40
-
41
-
42
-
43
-
44
-
45
-
 46
46 -
 47
47 -
 48
48 -
 49
49 -
 50
50 -
 51
51 -
 52
52 -
 53
53 -
 54
54 -
 55
55 -
 56
56 -
 57
57 -
 58
58 -
 59
59 -
 60
60 -
 61
61 -
 62
62 -
 63
63 -
 64
64 -
 65
65 -
 66
66 -
67
-
68
-
69
-
70
-
71
-
72
-
73
-
74
-
75
-
76
-
77
-
78
-
79
-
80
-
81
-
82
-
83
-
84
-
85
-
86
-
87
-
88
-
89
-
90
-
91
-
92
-
93
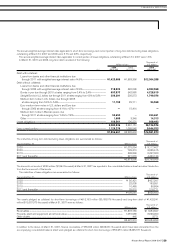
 |
 |

Thousands of
Millions of yen U.S. dollars (Note 3)
2006 2005 2004 2006
For the years ended Mar. 31, 2007 Mar. 31, 2006 Mar. 31, 2005 Mar. 31, 2007
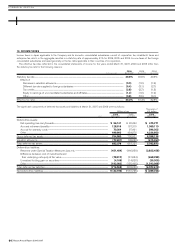
Operating activities
Income before income taxes and minority interests ¥ 697,432 ¥ 809,041 ¥ 793,233 $ 5,910,441
Depreciation and amortization relating to:
Leased assets 305,402 236,572 157,346 2,588,153
Other assets 465,821 418,830 368,580 3,947,636
Impairment loss 22,673 26,827 — 192,144
Provision for (reversal of) allowance for doubtful receivables 9,996 4,561 (6,464) 84,712
Loss on devaluation of securities 459 212 128 3,890
Interest and dividend income (25,546) (21,080) (16,274) (216,492)
Interest expense 145,547 104,265 73,220 1,233,449
Gain on sales of tangible fixed assets (28,485) (16,742) (24,038) (241,398)
Loss on disposal of fixed assets 25,403 22,213 20,115 215,280
Gain on sales of securities (3,566) (40,223) (7,232) (30,220)
Amortization of net retirement benefit obligation at transition 10,928 11,145 11,795 92,610
Provision for accrued retirement benefits 55,438 63,564 65,103 469,814
Retirement benefits paid (157,821) (314,349) (82,924) (1,337,466)
Other 12,118 13,587 (115) 102,695
Changes in operating assets and liabilities:
Notes and accounts receivable (114,960) 90,391 15,494 (974,237)
Finance receivables 44,341 (311,685) (794,349) 375,771
Inventories (88,765) (117,120) (108,903) (752,246)
Notes and accounts payable 54,368 88,129 152,213 460,744
Subtotal 1,430,783 1,068,138 616,928 12,125,280
Interest and dividends received 24,622 21,034 16,098 208,661
Interest paid (143,650) (102,219) (71,318) (1,217,373)
Income taxes paid (268,928) (229,084) (192,293) (2,279,051)
Net cash provided by operating activities 1,042,827 757,869 369,415 8,837,517
Investing activities
Decrease (increase) in short-term investments 7,210 7,078 (12,370) 61,102
Purchases of investment securities (17,117) (23,930) (31,896) (145,059)
Proceeds from sales of investment securities 36,486 46,060 3,098 309,203
Long-term loans made (12,625) (3,549) (4,019) (106,992)
Collection of long-term loans receivable 4,211 3,225 4,860 35,686
Purchases of fixed assets (546,848) (471,029) (461,146) (4,634,305)
Proceeds from sales of property, plant and equipment 72,308 55,790 71,256 612,780
Purchases of leased vehicles (957,356) (953,285) (590,605) (8,113,186)
Proceeds from sales of leased vehicles 304,912 264,124 173,812 2,584,000
Purchase of subsidiaries’ shares resulting in changes
in scope of consolidation (Note 15) (1,391) — (1,292) (11,788)
Proceeds from sales of subsidiaries’ shares resulting
in changes in scope of consolidation (Note 15) 1,308 4,705 7,697 11,085
Additional acquisition of shares of consolidated subsidiaries —(16,020) (500) —
Other (5,685) (25,924) (23,930) (48,179)
Net cash used in investing activities (1,114,587) (1,112,755) (865,035) (9,445,653)
Financing activities
Increase in short-term borrowings 492,538 376,048 666,191 4,174,051
Increase in long-term borrowings 969,461 883,548 1,050,841 8,215,771
Increase in bonds and debentures 123,730 390,706 140,663 1,048,559
Repayment of long-term borrowings (1,102,015) (809,466) (765,588) (9,339,110)
Redemption of bonds and debentures (190,515) (200,840) (379,946) (1,614,534)
Proceeds from minority shareholders 260 1,321 30 2,203
Purchases of treasury stock (10,375) (22,208) (33,366) (87,924)
Proceeds from sales of treasury stock 29,087 26,423 6,816 246,500
Repayment of lease obligations (66,775) (76,071) (69,244) (565,890)
Cash dividends paid (131,064) (105,661) (94,236) (1,110,712)
Cash dividends paid to minority shareholders (7,453) (6,487) (678) (63,161)
Other 33 606 (437) 281
Net cash provided by financing activities 106,912 457,919 521,046 906,034
Effect of exchange rate changes on cash and cash equivalents 16,640 11,389 4,369 141,017
Increase in cash and cash equivalents 51,792 114,422 29,795 438,915
Cash and cash equivalent at beginning of the year 404,212 289,784 194,164 3,425,525
Increase due to inclusion in consolidation 13,384 6 65,825 113,424
Cash and cash equivalent at end of the year ¥ 469,388 ¥ 404,212 ¥ 289,784 $ 3,977,864
See notes to consolidated financial statements.
CONSOLIDATED STATEMENTS OF CASH FLOWS
Nissan Motor Co., Ltd. and Consolidated Subsidiaries
Fiscal Years 2006, 2005 and 2004
Nissan Annual Report 2006-2007
54
»FINANCIAL SECTION