Nissan 2007 Annual Report Download - page 44
Download and view the complete annual report
Please find page 44 of the 2007 Nissan annual report below. You can navigate through the pages in the report by either clicking on the pages listed below, or by using the keyword search tool below to find specific information within the annual report.-
 1
1 -
2
-
3
-
4
-
5
-
6
-
7
-
8
-
9
-
10
-
11
-
12
-
13
-
14
-
15
-
16
-
17
-
18
-
19
-
20
-
21
-
22
-
23
-
24
-
25
-
26
-
27
-
28
-
29
-
30
-
31
-
32
-
33
-
 34
34 -
 35
35 -
 36
36 -
 37
37 -
 38
38 -
 39
39 -
 40
40 -
 41
41 -
 42
42 -
 43
43 -
 44
44 -
 45
45 -
 46
46 -
 47
47 -
 48
48 -
 49
49 -
 50
50 -
 51
51 -
 52
52 -
 53
53 -
 54
54 -
55
-
56
-
57
-
58
-
59
-
60
-
61
-
62
-
63
-
64
-
65
-
66
-
67
-
68
-
69
-
70
-
71
-
72
-
73
-
74
-
75
-
76
-
77
-
78
-
79
-
80
-
81
-
82
-
83
-
84
-
85
-
86
-
87
-
88
-
89
-
90
-
91
-
92
-
93
 |
 |

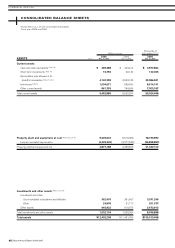
»FINANCIAL SECTION
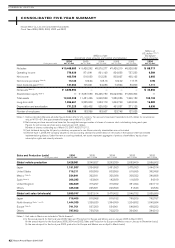
CONSOLIDATED FIVE-YEAR SUMMARY
Nissan Motor Co., Ltd. and Consolidated Subsidiaries
Fiscal Years 2006, 2005, 2004, 2003 and 2002
Nissan Annual Report 2006-2007
42
Millions of
U.S. dollars (Note 1)
Millions of yen (except per
(except per share amounts and number of employees) share amounts)
2006 2005 2004 2003 2002 2006
For the years ended Mar. 31, 2007 Mar. 31, 2006 Mar. 31, 2005 Mar. 31, 2004 Mar. 31, 2003 Mar. 31, 2007
Net sales ¥10,468,583 ¥ 9,428,292 ¥8,576,277 ¥7,429,219 ¥6,828,588 $ 88,717
Operating income 776,939 871,841 861,160 824,855 737,230 6,584
Net income 460,796 518,050 512,281 503,667 495,165 3,905
Net income per share (Note 2) 112.33 126.94 125.16 122.02 117.75 0.95
Cash dividends paid (Note 3) 131,064 105,661 94,236 74,594 50,800 1,111
Net assets (Note 4) ¥ 3,876,994 ————$ 32,856
Shareholders’ equity (Note 4) —¥ 3,087,983 ¥2,465,750 ¥2,023,994 ¥1,808,304 —
Total assets 12,402,208 11,481,426 9,848,523 7,859,856 7,349,183 105,103
Long-term debt 1,956,661 2,225,603 1,963,173 1,694,793 1,603,246 16,582
Depreciation and amortization 771,223 655,402 525,926 461,037 371,125 6,536
Number of employees 186,336 183,356 183,607 123,748 127,625
Notes: 1. Unless indicated otherwise, all dollar figures herein refer to U.S. currency. Yen amounts have been translated into U.S. dollars for convenience
only, at ¥118 = $1, the approximate exchange rate on March 31, 2007.
2. Net income per share amounts are based on the weighted average number of shares of common stock outstanding during each year.
Figures for net income per share are in exact yen and U.S. dollars.
Number of shares outstanding as of March 31, 2007: 4,520,715,112.
3. Cash dividends during the full year by subsidiary companies to non-Nissan minority shareholders are not included.
4. Effective April 1, 2006, the Company adopted a new accounting standard for presentation of net assets in the balance sheet and related
implementation guidance. Under the new accounting standard, net assets represent aggregate of previous shareholders’ equity, share
subscription rights and minority interests.
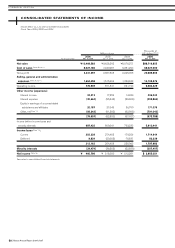
Sales and Production (units) 2006 2005 2004 2003 2002
For the years ended Mar. 31, 2007 Mar. 31, 2006 Mar. 31, 2005 Mar. 31, 2004 Mar. 31, 2003
Global vehicle production 3,428,981 3,340,827 3,293,339 2,883,409 2,586,602
Japan 1,191,937 1,364,868 1,481,563 1,475,063 1,444,314
United States 716,211 808,586 803,556 619,665 392,458
Mexico (Note 2) 534,841 362,591 325,086 308,322 340,658
Spain (Note 2) 266,295 193,604 142,889 116,589 84,919
United Kingdom 384,669 315,297 319,652 331,924 297,719
Others 335,028 295,881 220,593 31,846 26,534
Global unit sales (wholesale) 3,699,747 3,537,614 3,470,422 2,946,782 2,635,686
Japan 716,405 810,968 819,152 799,206 792,767
North America (Notes 1 and 2) 1,444,039 1,369,630 1,394,099 1,204,882 1,040,684
Europe (Note 2) 741,701 597,250 554,901 548,693 458,222
Others 797,602 759,766 702,270 394,001 344,013
Notes; 1. Unit sales in Mexico are included in “North America”.
2. In the annual reports for the fiscal year 2006, Sales and Production for Europe and Mexico are on January 2006 to March 2007.
(In the annual reports for the fiscal years 2005, 2004 and 2003, Sales and Production for Europe and Mexico was on January to December basis.)
(In the annual report for the fiscal year 2002, production for Europe and Mexico was on April to March basis.)