Nissan 2007 Annual Report Download - page 20
Download and view the complete annual report
Please find page 20 of the 2007 Nissan annual report below. You can navigate through the pages in the report by either clicking on the pages listed below, or by using the keyword search tool below to find specific information within the annual report.-
 1
1 -
2
-
3
-
4
-
5
-
6
-
7
-
8
-
9
-
 10
10 -
 11
11 -
 12
12 -
 13
13 -
 14
14 -
 15
15 -
 16
16 -
 17
17 -
 18
18 -
 19
19 -
 20
20 -
 21
21 -
 22
22 -
 23
23 -
 24
24 -
 25
25 -
 26
26 -
 27
27 -
 28
28 -
 29
29 -
 30
30 -
31
-
32
-
33
-
34
-
35
-
36
-
37
-
38
-
39
-
40
-
41
-
42
-
43
-
44
-
45
-
46
-
47
-
48
-
49
-
50
-
51
-
52
-
53
-
54
-
55
-
56
-
57
-
58
-
59
-
60
-
61
-
62
-
63
-
64
-
65
-
66
-
67
-
68
-
69
-
70
-
71
-
72
-
73
-
74
-
75
-
76
-
77
-
78
-
79
-
80
-
81
-
82
-
83
-
84
-
85
-
86
-
87
-
88
-
89
-
90
-
91
-
92
-
93
 |
 |

500
400
300
200
6
5
4
3
FY
’99 ’00 ’01 ’02 ’03 ’04 ’05 ’06 ’07
(Forecast)
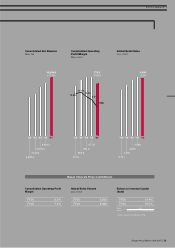
4.0% 3.8%
4.2% 4.4%
4.8%
4.6% 4.7%
4.4%
4.8%
239 232
262
300
354
398
448 465 490
R&D (left scale) % of net revenue (right scale)
Nissan Annual Report 2006-2007
18
40
30
20
10
0
FY
’99 ’00 ’01 ’02 ’03 ’04 ’05 ’06 ’07
(Forecast)
7
0
8
14
19
24
29
34
40
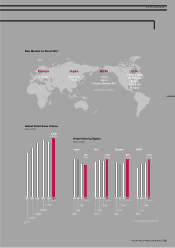
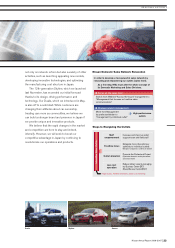
NRP Nissan 180 Nissan
Value-Up
Dividend Policy
(Dividend per share, in yen)
Current liabilities went up 14.9 percent to
¥5,575.3 billion. This was due to increases in short
term borrowings. Non-current liability decreased by
9.4 percent from fiscal 2005 to ¥2,949.9 billion.
This was mainly caused by the decrease in long
term borrowings.
Net assets increased 14.8 percent to ¥3,877.0
billion compared to ¥3,377.0 billion in fiscal 2005,
which had been adjusted for related implementation
guidance. This was mainly due to the increase in net
income of ¥460.8 billion, which was offset by the
decrease of ¥131.1 billion in dividends paid.
Automotive net cash change
Cash from operations totaled ¥1,038.6 billion. Free
cash flow totaled ¥21.0 billion by increased working
capital, tax payment and capital expenditures. Cash
outflow from financing activities totaled ¥165.7
billion, including ¥131.1 billion for dividend payments.
We had a net cash position of ¥254.7 billion at
the end of fiscal 2006, which represented a
decrease of ¥118.2 billion compared to the
beginning of the fiscal year. This was due to the
decrease in cash from operations and increase in
capital expenditures.
Credit rating
R&I had Nissan’s long term credit rating listed as A,
as of May 16, 2005. S&P upgraded our rating from
BBB to BBB+ on July 20, 2004, and Moody’s
upgraded us from Baa3 to Baa1 on March 9, 2004.
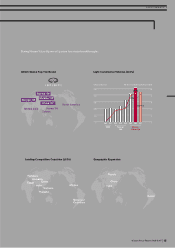
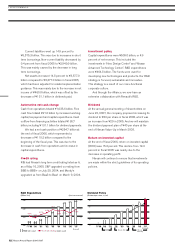
Investment policy
Capital expenditures were ¥509.0 billion, or 4.9
percent of net revenue. This included the
investments in “New Design Center” and “Nissan
Advanced Technology Center”. R&D expenditures
were ¥464.8 billion. The funds were used for
developing new technologies and products. Our R&D
strategy is focused, sustainable and innovative.
This strategy is a result of our cross-functional
corporate culture.
And through the Alliance, we now have an
extensive collaboration with Renault’s R&D.
Dividend
At the annual general meeting of shareholders on
June 20, 2007, the company proposed increasing its
dividend to ¥34 per share in fiscal 2006, which was
an increase from ¥29 in 2005. And we will maintain
the dividend payment plan of ¥40 per share at the
end of Nissan Value-Up in March 2008.
Return on invested capital
At the end of fiscal 2006, return on invested capital
(ROIC) was 15.3 percent. This decline from 19.4
percent in fiscal 2005 was mainly due to the
decrease in operating profit.
Nissan will continue to ensure that investments
are made within the strict guidelines of its operating
policies.
R&D Expenditure
(Billion Yen) (% of net revenue)
»PERFORMANCE