Nissan 2007 Annual Report Download - page 76
Download and view the complete annual report
Please find page 76 of the 2007 Nissan annual report below. You can navigate through the pages in the report by either clicking on the pages listed below, or by using the keyword search tool below to find specific information within the annual report.-
 1
1 -
2
-
3
-
4
-
5
-
6
-
7
-
8
-
9
-
10
-
11
-
12
-
13
-
14
-
15
-
16
-
17
-
18
-
19
-
20
-
21
-
22
-
23
-
24
-
25
-
26
-
27
-
28
-
29
-
30
-
31
-
32
-
33
-
34
-
35
-
36
-
37
-
38
-
39
-
40
-
41
-
42
-
43
-
44
-
45
-
46
-
47
-
48
-
49
-
50
-
51
-
52
-
53
-
54
-
55
-
56
-
57
-
58
-
59
-
60
-
61
-
62
-
63
-
64
-
65
-
 66
66 -
 67
67 -
 68
68 -
 69
69 -
 70
70 -
 71
71 -
 72
72 -
 73
73 -
 74
74 -
 75
75 -
 76
76 -
 77
77 -
 78
78 -
 79
79 -
 80
80 -
 81
81 -
 82
82 -
 83
83 -
 84
84 -
 85
85 -
 86
86 -
87
-
88
-
89
-
90
-
91
-
92
-
93
 |
 |
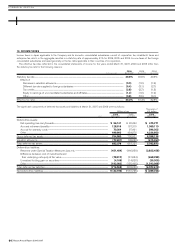
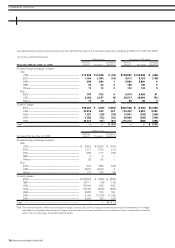
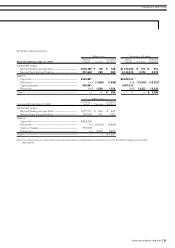
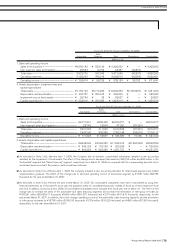
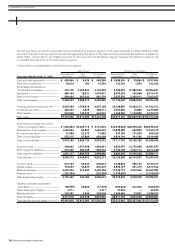
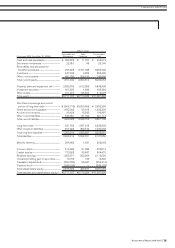
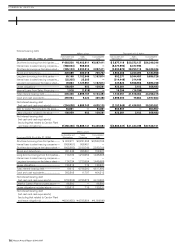
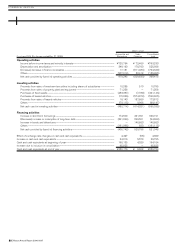
The following tables set forth the summarized financial statements by business segment for the years ended Mar 31, 2007, 2006 and 2005.
Amounts for the sales financing segment represent the aggregate of the figures for the sales financing subsidiaries and operations in Japan, the
United States, Canada, Mexico and Thailand. Amounts for the automobile and Eliminations segment represent the differences between the
consolidated totals and those for the sales financing segment.
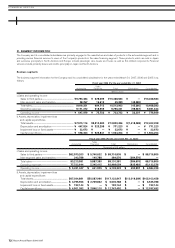
1) Summarized consolidated balance sheets by business segment
Millions of yen Thousands of U.S. dollars
Automobile and Sales Consolidated Automobile and Sales Consolidated
Fiscal year 2006 (As of Mar. 31, 2007) Eliminations Financing total Eliminations Financing total
Cash and cash equivalents................................... ¥ 459,964 ¥ 9,424 ¥ 469,388 $ 3,898,000 $ 79,864 $ 3,977,864
Short-term investments........................................... 16,610 182 16,792 140,763 1,542 142,305
Receivables, less allowance
for doubtful receivables........................................ 437,415 3,702,844 4,140,259 3,706,907 31,380,034 35,086,941
Inventories.......................................................................... 986,150 18,521 1,004,671 8,357,203 156,958 8,514,161
Other current assets .................................................. 594,434 267,342 861,776 5,037,576 2,265,611 7,303,187
Total current assets.................................................... 2,494,573 3,998,313 6,492,886 21,140,449 33,884,009 55,024,458
Property, plant and equipment, net ................ 3,097,369 1,779,819 4,877,188 26,248,890 15,083,212 41,332,102
Investment securities................................................. 384,337 1,875 386,212 3,257,093 15,890 3,272,983
Other assets...................................................................... 515,549 130,373 645,922 4,369,060 1,104,855 5,473,915
Total assets ....................................................................... ¥6,491,828 ¥5,910,380 ¥12,402,208 $55,015,492 $50,087,966 $105,103,458
Short-term borrowings and current
portion of long-term debt.................................... ¥ (245,284) ¥3,393,116 ¥ 3,147,832 $ (2,078,678) $28,755,220 $26,676,542
Notes and accounts payable............................... 1,637,666 54,857 1,692,523 13,878,525 464,890 14,343,415
Accrued income taxes.............................................. 51,588 20,277 71,865 437,186 171,839 609,025
Other current liabilities............................................. 575,215 87,884 663,099 4,874,704 744,780 5,619,484
Total current liabilities............................................... 2,019,185 3,556,134 5,575,319 17,111,737 30,136,729 47,248,466
Long-term debt .............................................................. 448,692 1,507,969 1,956,661 3,802,475 12,779,398 16,581,873
Other long-term liabilities....................................... 612,435 380,799 993,234 5,190,128 3,227,110 8,417,238
Total long-term liabilities......................................... 1,061,127 1,888,768 2,949,895 8,992,603 16,006,508 24,999,111
Total liabilities.................................................................. 3,080,312 5,444,902 8,525,214 26,104,340 46,143,237 72,247,577
Common stock................................................................ 513,167 92,647 605,814 4,348,873 785,144 5,134,017
Capital surplus................................................................. 773,623 30,847 804,470 6,556,127 261,415 6,817,542
Retained earnings........................................................ 2,092,036 310,690 2,402,726 17,729,119 2,632,966 20,362,085
Treasury stock................................................................. (226,394) — (226,394) (1,918,593) — (1,918,593)
Total shareholders' equity...................................... 3,152,432 434,184 3,586,616 26,715,526 3,679,525 30,395,051
Valuation, translation adjustment
and others........................................................................ (69,979) 28,600 (41,379) (593,043) 242,373 (350,670)
Share Subscription Rights..................................... 2,711 — 2,711 22,975 — 22,975
Minority interests........................................................... 326,352 2,694 329,046 2,765,694 22,831 2,788,525
Total net assets.............................................................. 3,411,516 465,478 3,876,994 28,911,152 3,944,729 32,855,881
Total liabilities and net assets ............................ ¥6,491,828 ¥5,910,380 ¥12,402,208 $55,015,492 $50,087,966 $105,103,458
Nissan Annual Report 2006-2007
74
»FINANCIAL SECTION