Nissan 2007 Annual Report Download - page 81
Download and view the complete annual report
Please find page 81 of the 2007 Nissan annual report below. You can navigate through the pages in the report by either clicking on the pages listed below, or by using the keyword search tool below to find specific information within the annual report.-
 1
1 -
2
-
3
-
4
-
5
-
6
-
7
-
8
-
9
-
10
-
11
-
12
-
13
-
14
-
15
-
16
-
17
-
18
-
19
-
20
-
21
-
22
-
23
-
24
-
25
-
26
-
27
-
28
-
29
-
30
-
31
-
32
-
33
-
34
-
35
-
36
-
37
-
38
-
39
-
40
-
41
-
42
-
43
-
44
-
45
-
46
-
47
-
48
-
49
-
50
-
51
-
52
-
53
-
54
-
55
-
56
-
57
-
58
-
59
-
60
-
61
-
62
-
63
-
64
-
65
-
66
-
67
-
68
-
69
-
70
-
 71
71 -
 72
72 -
 73
73 -
 74
74 -
 75
75 -
 76
76 -
 77
77 -
 78
78 -
 79
79 -
 80
80 -
 81
81 -
 82
82 -
 83
83 -
 84
84 -
 85
85 -
 86
86 -
 87
87 -
 88
88 -
 89
89 -
 90
90 -
 91
91 -
92
-
93
 |
 |

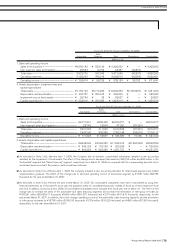
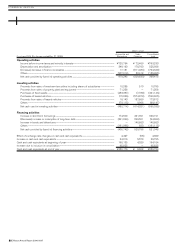
Millions of yen
Automobile and Sales Consolidated
Fiscal year 2005 (For the year ended Mar. 31, 2006) Eliminations Financing total
Operating activities
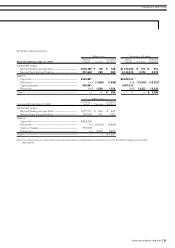
Income before income taxes and minority interests................................................................................................... ¥739,962 ¥ 69,079 ¥ 809,041
Depreciation and amortization...................................................................................................................................................... 400,787 254,615 655,402
(Increase) decrease in finance receivables ....................................................................................................................... 19,341 (331,026) (311,685)
Others ............................................................................................................................................................................................................... (468,999) 74,110 (394,889)
Net cash provided by operating activities............................................................................................................................ 691,091 66,778 757,869
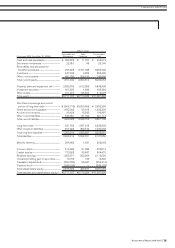
Investing activities
Proceeds from sales of investment securities including shares of subsidiaries................................. 50,765 — 50,765
Proceeds from sales of property, plant and equipment........................................................................................... 55,789 1 55,790
Purchases of fixed assets................................................................................................................................................................ (456,550) (14,479) (471,029)
Purchases of leased vehicles........................................................................................................................................................ (47,366) (905,919) (953,285)
Proceeds from sales of leased vehicles............................................................................................................................... 37,523 226,601 264,124
Others ............................................................................................................................................................................................................... (59,951) 831 (59,120)
Net cash used in investing activities........................................................................................................................................ (419,790) (692,965) (1,112,755)
Financing activities
Increase in short-term borrowings ........................................................................................................................................... 16,565 359,483 376,048
(Decrease) increase or redemption of long-term debt............................................................................................. (228,985) 102,227 (126,758)
Increase in bonds and debentures............................................................................................................................................ 227,386 163,320 390,706
Others ............................................................................................................................................................................................................... (183,960) 1,883 (182,077)
Net cash provided by (used in) financing activities..................................................................................................... (168,994) 626,913 457,919
Effect of exchange rate changes on cash and cash equivalents............................................................................. 10,016 1,373 11,389
Increase in cash and cash equivalents .......................................................................................................................................... 112,323 2,099 114,422
Cash and cash equivalents at beginning of year.................................................................................................................... 280,176 9,608 289,784
Increase due to inclusion in consolidation................................................................................................................................... 6 — 6
Cash and cash equivalents at end of year................................................................................................................................... ¥392,505 ¥ 11,707 ¥ 404,212
Nissan Annual Report 2006-2007 79
FINANCIAL SECTION»