Nissan 2007 Annual Report Download - page 65
Download and view the complete annual report
Please find page 65 of the 2007 Nissan annual report below. You can navigate through the pages in the report by either clicking on the pages listed below, or by using the keyword search tool below to find specific information within the annual report.-
 1
1 -
2
-
3
-
4
-
5
-
6
-
7
-
8
-
9
-
10
-
11
-
12
-
13
-
14
-
15
-
16
-
17
-
18
-
19
-
20
-
21
-
22
-
23
-
24
-
25
-
26
-
27
-
28
-
29
-
30
-
31
-
32
-
33
-
34
-
35
-
36
-
37
-
38
-
39
-
40
-
41
-
42
-
43
-
44
-
45
-
46
-
47
-
48
-
49
-
50
-
51
-
52
-
53
-
54
-
 55
55 -
 56
56 -
 57
57 -
 58
58 -
 59
59 -
 60
60 -
 61
61 -
 62
62 -
 63
63 -
 64
64 -
 65
65 -
 66
66 -
 67
67 -
 68
68 -
 69
69 -
 70
70 -
 71
71 -
 72
72 -
 73
73 -
 74
74 -
 75
75 -
76
-
77
-
78
-
79
-
80
-
81
-
82
-
83
-
84
-
85
-
86
-
87
-
88
-
89
-
90
-
91
-
92
-
93
 |
 |

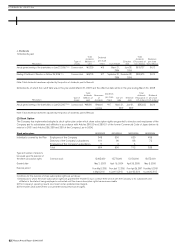
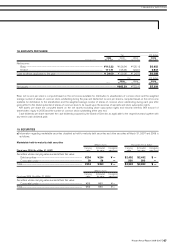
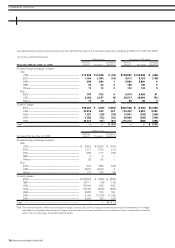
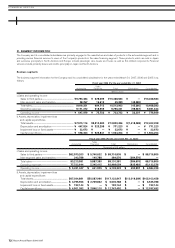
Number and activity of stock options NESS2003 NESS2004 NESS2005 NESS2006
Share subscription rights which are not yet vested.
Outstanding as of March 31, 2006 — 10,078,000 13,150,000 —
Granted — — — 13,075,000
Forfeited — — 4,728,000 75,000
Vested — 10,078,000 — —
Outstanding as of March 31, 2007 — — 8,422,000 13,000,000
Share subscription rights which have already been vested
Outstanding as of March 31, 2006 8,655,500 — — —
Vested — 10,078,000 — —
Exercised 1,434,100 690,400 — —
Forfeited 20,000 109,500 — —
Outstanding as of March 31, 2007 7,201,400 9,278,100 — —
Exercise price (yen) 932 1,202 1,119 1,526
Weighted average exercise price (yen) 1,386 1,403 — —
Weighted average fair value per stock at the granted date (yen) — — — 222.3
Stock option expense included in selling, general and administrative expenses for the year ended March 31, 2007 amounted to ¥1,037 million
($8,788 thousand). The fair value of options granted is estimated using the binominal model with the following weighted average assumptions.
NESS2006
Expected volatility 21.00%
Expected holding period 5.5 years
Expected dividend 40 yen
Risk-free rate 1.50%
Nissan Annual Report 2006-2007 63
FINANCIAL SECTION»
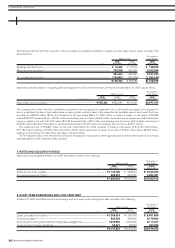
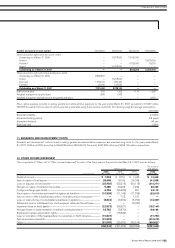
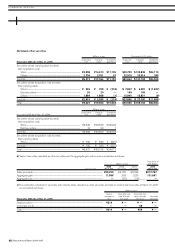
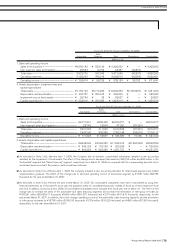
12. OTHER INCOME (EXPENSES)
The components of “Other, net” in “Other income (expenses)” for each of the three years in the period ended March 31, 2007 were as follows:
Thousands of
Millions of yen U.S. dollars
2006 2005 2004 2006
For the years ended Mar. 31, 2007 Mar. 31, 2006 Mar. 31, 2005 Mar. 31, 2007
Dividend income.............................................................................................................................................................. ¥ 1,233 ¥ 3,721 ¥ 1,340 $ 10,449
Gain on sales of fixed assets................................................................................................................................ 28,498 16,742 24,038 241,508
Loss on disposal of fixed assets........................................................................................................................ (25,402) (22,213) (20,115) (215,271)
Net gain on sales of investment securities............................................................................................... 9,480 40,223 7,232 80,339
Foreign exchange gain (loss)............................................................................................................................... 5,796 (34,836) 801 49,119
Amortization of net retirement benefit obligation at transition.................................................. (10,928) (11,145) (11,795) (92,610)
Gain on return of the substitutional portion of welfare pension fund plans................... —772 1,107 —
Loss on restructuring of consolidated subsidiaries’ operations............................................... (3,824) (9,404) (8,752) (32,407)
Settlement loss on withdrawal from multi-employer retirement benefit plan............... —— (6,337) —
Impairment loss on fixed assets......................................................................................................................... (22,673) (26,827) — (192,144)
Net gain (loss) on implementation of defined contribution plans........................................... 18,782 (3,570) — 159,169
Expenses for share appreciation rights ....................................................................................................... —(18,332) — —
Loss on relocation of the headquarters of a subsidiary in North America...................... (10,827) ——(91,754)
Special severance benefits .................................................................................................................................... (31,933) ——(270,619)
Other......................................................................................................................................................................................... (51,545) (26,693) (80,514) (436,821)
....................................................................................................................................................................................................... ¥(93,343) ¥(91,562) ¥(92,995) $(791,042)
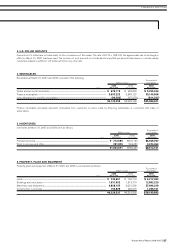
11. RESEARCH AND DEVELOPMENT COSTS
Research and development costs included in selling, general and administrative expenses and manufacturing costs for the years ended March
31, 2007, 2006 and 2005 amounted to ¥464,839 million ($3,939,314 thousand), ¥447,582 million and ¥398,148 million, respectively.