Nissan 2007 Annual Report Download - page 79
Download and view the complete annual report
Please find page 79 of the 2007 Nissan annual report below. You can navigate through the pages in the report by either clicking on the pages listed below, or by using the keyword search tool below to find specific information within the annual report.-
 1
1 -
2
-
3
-
4
-
5
-
6
-
7
-
8
-
9
-
10
-
11
-
12
-
13
-
14
-
15
-
16
-
17
-
18
-
19
-
20
-
21
-
22
-
23
-
24
-
25
-
26
-
27
-
28
-
29
-
30
-
31
-
32
-
33
-
34
-
35
-
36
-
37
-
38
-
39
-
40
-
41
-
42
-
43
-
44
-
45
-
46
-
47
-
48
-
49
-
50
-
51
-
52
-
53
-
54
-
55
-
56
-
57
-
58
-
59
-
60
-
61
-
62
-
63
-
64
-
65
-
66
-
67
-
68
-
 69
69 -
 70
70 -
 71
71 -
 72
72 -
 73
73 -
 74
74 -
 75
75 -
 76
76 -
 77
77 -
 78
78 -
 79
79 -
 80
80 -
 81
81 -
 82
82 -
 83
83 -
 84
84 -
 85
85 -
 86
86 -
 87
87 -
 88
88 -
 89
89 -
90
-
91
-
92
-
93
 |
 |
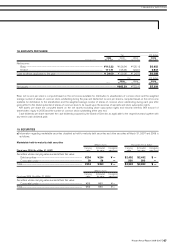
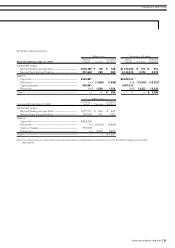
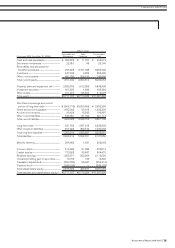
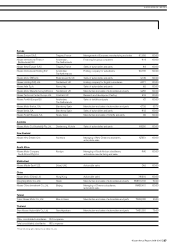
2) Summarized consolidated statements of income by business segment
Millions of yen Thousands of U.S. dollars
Automobile and Sales Consolidated Automobile and Sales Consolidated
Fiscal year 2006
(For the year ended Mar. 31, 2007)
Eliminations Financing total Eliminations Financing total
Net sales.................................................................................... ¥9,773,871 ¥694,712 ¥10,468,583 $82,829,415 $5,887,390 $88,716,805
Cost of sales........................................................................... 7,498,350 528,836 8,027,186 63,545,339 4,481,661 68,027,000
Gross profit.............................................................................. 2,275,521 165,876 2,441,397 19,284,076 1,405,729 20,689,805
Operating income............................................................... 701,186 75,753 776,939 5,942,254 641,975 6,584,229
Operating income as a percentage of net sales
...... 7.2% 10.9% 7.4% 7.2% 10.9% 7.4%
Net financial cost................................................................ (5,664) 546 (5,118) (48,000) 4,627 (43,373)
Income before income taxes and
minority interests.............................................................. 621,236 76,196 697,432 5,264,712 645,729 5,910,441
Net income............................................................................... ¥ 413,529 ¥ 47,267 ¥ 460,796 $ 3,504,483 $ 400,568 $ 3,905,051
Total net financial cost................................................... ¥ (5,664) ¥ 546 ¥ (5,118) $ (48,000) $ 4,627 $ (43,373)
Interest on lease obligations ..................................... (3,323) (13) (3,336) (28,161) (110) (28,271)
Intersegment eliminations ........................................... (55,569) — (55,569) (470,924) — (470,924)
Net financial cost for segment ................................ 53,228 559 53,787 451,085 4,737 455,822
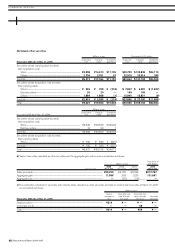
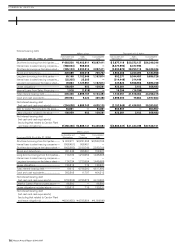
Millions of yen
Automobile and Sales Consolidated
Fiscal year 2005
(For the year ended Mar. 31, 2006)
Eliminations Financing total
Net sales.................................................................................... ¥8,880,349 ¥547,943 ¥9,428,292
Cost of sales........................................................................... 6,649,937 391,050 7,040,987
Gross profit.............................................................................. 2,230,412 156,893 2,387,305
Operating income............................................................... 802,116 69,725 871,841
Operating income as a percentage of net sales
...... 9.0% 12.7% 9.2%
Net financial cost................................................................ (4,555) (11) (4,566)
Income before income taxes and
minority interests.............................................................. 739,962 69,079 809,041
Net income............................................................................... ¥ 476,688 ¥ 41,362 ¥ 518,050
Total net financial cost................................................... ¥ (4,555) ¥ (11) ¥ (4,566)
Interest on lease obligations ..................................... (3,952) (16) (3,968)
Intersegment eliminations ........................................... (37,507) — (37,507)
Net financial cost for segment ................................ 36,904 5 36,909
Millions of yen
Automobile and Sales Consolidated
Fiscal year 2004
(For the year ended Mar. 31, 2005)
Eliminations Financing total
Net sales.................................................................................... ¥8,164,332 ¥411,945 ¥8,576,277
Cost of sales........................................................................... 6,094,196 257,073 6,351,269
Gross profit.............................................................................. 2,070,136 154,872 2,225,008
Operating income............................................................... 787,603 73,557 861,160
Operating income as a percentage of net sales
...... 9.6% 17.9% 10.0%
Net financial cost................................................................ (10,371) (11) (10,382)
Income before income taxes and
minority interests.............................................................. 720,764 72,469 793,233
Net income............................................................................... ¥ 472,680 ¥ 39,601 ¥ 512,281
Total net financial cost................................................... ¥ (10,371) ¥ (11) ¥ (10,382)
Interest on lease obligations ..................................... (4,097) (20) (4,117)
Intersegment eliminations ........................................... (12,524) — (12,524)
Net financial cost for segment ................................ 6,250 9 6,259
Nissan Annual Report 2006-2007 77
FINANCIAL SECTION»