Nissan 2007 Annual Report Download - page 80
Download and view the complete annual report
Please find page 80 of the 2007 Nissan annual report below. You can navigate through the pages in the report by either clicking on the pages listed below, or by using the keyword search tool below to find specific information within the annual report.-
 1
1 -
2
-
3
-
4
-
5
-
6
-
7
-
8
-
9
-
10
-
11
-
12
-
13
-
14
-
15
-
16
-
17
-
18
-
19
-
20
-
21
-
22
-
23
-
24
-
25
-
26
-
27
-
28
-
29
-
30
-
31
-
32
-
33
-
34
-
35
-
36
-
37
-
38
-
39
-
40
-
41
-
42
-
43
-
44
-
45
-
46
-
47
-
48
-
49
-
50
-
51
-
52
-
53
-
54
-
55
-
56
-
57
-
58
-
59
-
60
-
61
-
62
-
63
-
64
-
65
-
66
-
67
-
68
-
69
-
 70
70 -
 71
71 -
 72
72 -
 73
73 -
 74
74 -
 75
75 -
 76
76 -
 77
77 -
 78
78 -
 79
79 -
 80
80 -
 81
81 -
 82
82 -
 83
83 -
 84
84 -
 85
85 -
 86
86 -
 87
87 -
 88
88 -
 89
89 -
 90
90 -
91
-
92
-
93
 |
 |

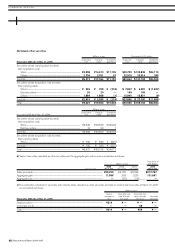
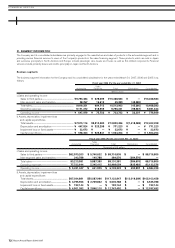
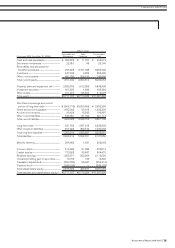
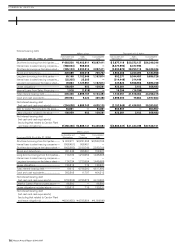
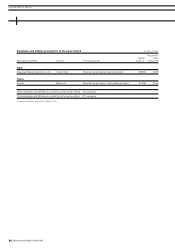
3) Summarized consolidated statements of cash flows by business segment
Millions of yen Thousands of U.S. dollars
Automobile and Sales Consolidated Automobile and Sales Consolidated
Fiscal year 2006 (For the year ended Mar. 31, 2007) Eliminations Financing total Eliminations Financing total
Operating activities
Income before income taxes and
minority interests............................................................... ¥621,236 ¥ 76,196 ¥ 697,432 $5,264,712 $ 645,729 $5,910,441
Depreciation and amortization.................................. 447,924 323,299 771,223 3,795,966 2,739,822 6,535,788
Increase (decrease) in finance receivables.... (22,914) 67,255 44,341 (194,187) 569,958 375,771
Others ........................................................................................... (528,386) 58,217 (470,169) (4,477,847) 493,364 (3,984,483)
Net cash provided by operating activities........ 517,860 524,967 1,042,827 4,388,644 4,448,873 8,837,517
Investing activities
Proceeds from sales of investment securities
including shares of subsidiaries............................ 37,794 — 37,794 320,288 — 320,288
Proceeds from sales of property,
plant and equipment....................................................... 72,308 0 72,308 612,780 0 612,780
Purchases of fixed assets............................................ (537,129) (9,719) (546,848) (4,551,941) (82,364) (4,634,305)
Purchases of leased vehicles.................................... (41,234) (916,122) (957,356) (349,440) (7,763,746) (8,113,186)
Proceeds from sales of leased vehicles ........... 7,253 297,659 304,912 61,466 2,522,534 2,584,000
Others ........................................................................................... (35,804) 10,407 (25,397) (303,425) 88,195 (215,230)
Net cash used in investing activities.................... (496,812) (617,775) (1,114,587) (4,210,272) (5,235,381) (9,445,653)
Financing activities
Increase in short-term borrowings......................... 418,824 73,714 492,538 3,549,356 624,695 4,174,051
Decrease or redemption of long-term debt... (215,299) (107,770) (323,069) (1,824,568) (913,305) (2,737,873)
Increase in bonds and debentures........................ — 123,730 123,730 — 1,048,559 1,048,559
Others ........................................................................................... (186,460) 173 (186,287) (1,580,169) 1,466 (1,578,703)
Net cash provided by financing activities......... 17,065 89,847 106,912 144,619 761,415 906,034
Effect of exchange rate changes on
cash and cash equivalents................................................. 16,775 (135) 16,640 142,161 (1,144) 141,017
Increase (Decrease) in cash and
cash equivalents......................................................................... 54,888 (3,096) 51,792 465,152 (26,237) 438,915
Cash and cash equivalents at beginning of yea
r...... 392,505 11,707 404,212 3,326,314 99,211 3,425,525
Increase due to inclusion in consolidation............... 12,571 813 13,384 106,534 6,890 113,424
Cash and cash equivalents at end of year............... ¥459,964 ¥ 9,424 ¥ 469,388 $3,898,000 $ 79,864 $3,977,864
Nissan Annual Report 2006-2007
78
»FINANCIAL SECTION