Nissan 2007 Annual Report Download - page 3
Download and view the complete annual report
Please find page 3 of the 2007 Nissan annual report below. You can navigate through the pages in the report by either clicking on the pages listed below, or by using the keyword search tool below to find specific information within the annual report.-
 1
1 -
 2
2 -
 3
3 -
 4
4 -
 5
5 -
 6
6 -
 7
7 -
 8
8 -
 9
9 -
 10
10 -
 11
11 -
 12
12 -
 13
13 -
 14
14 -
15
-
16
-
17
-
18
-
19
-
20
-
21
-
22
-
23
-
24
-
25
-
26
-
27
-
28
-
29
-
30
-
31
-
32
-
33
-
34
-
35
-
36
-
37
-
38
-
39
-
40
-
41
-
42
-
43
-
44
-
45
-
46
-
47
-
48
-
49
-
50
-
51
-
52
-
53
-
54
-
55
-
56
-
57
-
58
-
59
-
60
-
61
-
62
-
63
-
64
-
65
-
66
-
67
-
68
-
69
-
70
-
71
-
72
-
73
-
74
-
75
-
76
-
77
-
78
-
79
-
80
-
81
-
82
-
83
-
84
-
85
-
86
-
87
-
88
-
89
-
90
-
91
-
92
-
93
 |
 |
Nissan Annual Report 2006-2007 1
Millions of
U.S. dollars (Note 1)
Millions of yen (except per
(except per share amounts and number of employees) share amounts)
2006 2005 2004 2003 2002 2006
For the years ended Mar. 31, 2007 Mar. 31, 2006 Mar. 31, 2005 Mar. 31, 2004 Mar. 31, 2003 Mar. 31, 2007
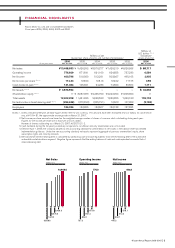
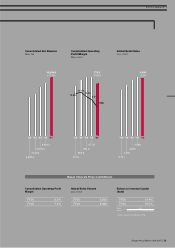
Net sales ¥10,468,583 ¥ 9,428,292 ¥8,576,277 ¥7,429,219 ¥6,828,588 $ 88,717
Operating income 776,939 871,841 861,160 824,855 737,230 6,584
Net income 460,796 518,050 512,281 503,667 495,165 3,905
Net income per share (Note 2) 112.33 126.94 125.16 122.02 117.75 0.95
Cash dividends paid (Note 3) 131,064 105,661 94,236 74,594 50,800 1,111
Net assets (Note 4) ¥ 3,876,994 ————$ 32,856
Shareholders’ equity (Note 4) —¥ 3,087,983 ¥2,465,750 ¥2,023,994 ¥1,808,304 —
Total assets 12,402,208 11,481,426 9,848,523 7,859,856 7,349,183 105,103
Net automotive interest-bearing debt (Note 5) (254,638) (372,893) (205,791) 13,603 107,952 (2,158)
Employees 186,336 183,356 183,607 123,748 127,625
Notes: 1. Unless indicated otherwise, all dollar figures herein refer to U.S. currency. Yen amounts have been translated into U.S. dollars, for convenience
only, at ¥118= $1, the approximate exchange rate on March 31, 2007.
2. Net income per share amounts are based on the weighted average number of shares of common stock outstanding during each year.
Figures for net income per share are in exact yen and U.S. dollars.
Number of shares outstanding as of March 31, 2007: 4,520,715,112.
3. Cash dividends during the full year by subsidiary companies to non-Nissan minority shareholders are not included.
4. Effective April 1, 2006, the Company adopted a new accounting standard for presentation of net assets in the balance sheet and related
implementation guidance. Under the new accounting standard, net assets represent aggregate of previous shareholders' equity, share
subscription rights and minority interests.
5. Net automotive interest-bearing debt is calculated by subtracting cash and cash equivalents from interest-bearing debt in the automotive
automobile and eliminations segment. Negative figure represents that the ending balance of cash and cash equivalents exceeds that of
interest-bearing debt.
FINANCIAL HIGHLIGHTS
Nissan Motor Co., Ltd. and Consolidated Subsidiaries
Fiscal years 2006, 2005, 2004, 2003 and 2002
’02 ’03 ’04 ’05 ’06 ’02 ’03 ’04 ’05 ’06 ’02 ’03 ’04 ’05 ’06
6,828.6
7,429.2
9,428.3
8,576.3
10,468.6
737.2
824.9
871.8
861.2
776.9
495.2
503.7
518.1
512.3
460.8
Net Sales
(Billion Yen)
Operating Income
(Billion Yen)
Net Income
(Billion Yen)