NetFlix 2002 Annual Report Download - page 74
Download and view the complete annual report
Please find page 74 of the 2002 NetFlix annual report below. You can navigate through the pages in the report by either clicking on the pages listed below, or by using the keyword search tool below to find specific information within the annual report.-
 1
1 -
2
-
3
-
4
-
5
-
6
-
7
-
8
-
9
-
10
-
11
-
12
-
13
-
14
-
15
-
16
-
17
-
18
-
19
-
20
-
21
-
22
-
23
-
24
-
25
-
26
-
27
-
28
-
29
-
30
-
31
-
32
-
33
-
34
-
35
-
36
-
37
-
38
-
39
-
40
-
41
-
42
-
43
-
44
-
45
-
46
-
47
-
48
-
49
-
50
-
51
-
52
-
53
-
54
-
55
-
56
-
57
-
58
-
59
-
60
-
61
-
62
-
63
-
 64
64 -
 65
65 -
 66
66 -
 67
67 -
 68
68 -
 69
69 -
 70
70 -
 71
71 -
 72
72 -
 73
73 -
 74
74 -
 75
75 -
 76
76 -
 77
77 -
 78
78 -
 79
79 -
 80
80 -
 81
81 -
 82
82 -
 83
83 -
 84
84 -
85
-
86
 |
 |

NETFLIX, INC.
NOTES TO FINANCIAL STATEMENTS—(Continued)
Years Ended December 31, 2000, 2001 and 2002
(in thousands, except share, per share and per DVD data)
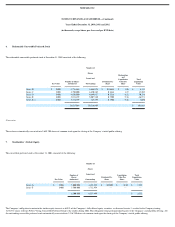
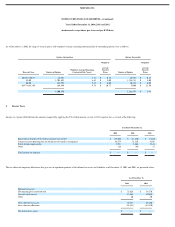
As of December 31, 2002, the range of exercise prices and weighted−average remaining contractual life of outstanding options were as follows:
Options Outstanding Options Exercisable
Exercise Prices Number of Options Weighted−Average Remaining
Contractual Life (Years)
Weighted−
Average
Exercise
Prices Number of Options
Weighted−
Average
Exercise
Prices
$0.15 to $0.33 44,987 5.17 $ 0.15 44,987 $ 0.15
$3.00 3,703,101 8.62 $ 3.00 1,228,213 $ 3.00
$6.00 182,992 9.25 $ 6.00 10,333 $ 6.00
$8.97 to $13.99 169,450 9.74 $ 10.77 5,000 $ 13.50
4,100,530 1,288,533 $ 2.98
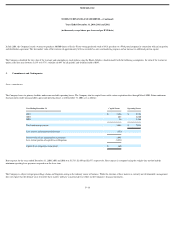
8. Income Taxes
Income tax expense differed from the amounts computed by applying the U.S. federal income tax rate of 34% to pretax loss as a result of the following:
Year Ended December 31,
2000 2001 2002
Expected tax benefit at U.S. federal statutory rate of 34% $ (19,503) $ (13,130) $ (7,463)
Current year net operating loss for which no tax benefit is recognized 16,574 11,330 4,105
Stock−based compensation 2,957 1,864 3,343
Other (28) (64) 15
Total income tax expense $ — $ — $ —
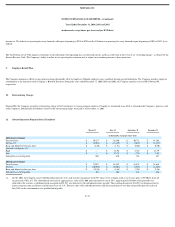
The tax effects of temporary differences that give rise to significant portions of the deferred tax assets and liabilities as of December 31, 2001 and 2002, are presented below:
As of December 31,
2001 2002
Deferred tax assets:
Net operating loss carryforwards $ 32,626 $ 34,270
Accruals and reserves 13,885 10,880
Other 20 80
Gross deferred tax assets 46,531 45,230
Less valuation allowance (46,531) (45,230)
Net deferred tax assets $ — $ —