NetFlix 2002 Annual Report Download - page 63
Download and view the complete annual report
Please find page 63 of the 2002 NetFlix annual report below. You can navigate through the pages in the report by either clicking on the pages listed below, or by using the keyword search tool below to find specific information within the annual report.-
 1
1 -
2
-
3
-
4
-
5
-
6
-
7
-
8
-
9
-
10
-
11
-
12
-
13
-
14
-
15
-
16
-
17
-
18
-
19
-
20
-
21
-
22
-
23
-
24
-
25
-
26
-
27
-
28
-
29
-
30
-
31
-
32
-
33
-
34
-
35
-
36
-
37
-
38
-
39
-
40
-
41
-
42
-
43
-
44
-
45
-
46
-
47
-
48
-
49
-
50
-
51
-
52
-
 53
53 -
 54
54 -
 55
55 -
 56
56 -
 57
57 -
 58
58 -
 59
59 -
 60
60 -
 61
61 -
 62
62 -
 63
63 -
 64
64 -
 65
65 -
 66
66 -
 67
67 -
 68
68 -
 69
69 -
 70
70 -
 71
71 -
 72
72 -
 73
73 -
74
-
75
-
76
-
77
-
78
-
79
-
80
-
81
-
82
-
83
-
84
-
85
-
86
 |
 |

NETFLIX, INC.
NOTES TO FINANCIAL STATEMENTS—(Continued)
Years Ended December 31, 2000, 2001 and 2002
(in thousands, except share, per share and per DVD data)
Net loss per share
Basic net loss per share is computed using the weighted−average number of outstanding shares of common stock, excluding common stock subject to repurchase. Diluted net loss per share is
computed using the weighted−average number of outstanding shares of common stock and, when dilutive, potential common stock from outstanding options and warrants to purchase
common stock, using the treasury stock method, and convertible securities using the “if−converted” method. All potential common stock issuances have been excluded from the
computations of diluted net loss per share for all periods presented because the effect would be antidilutive.
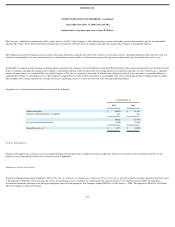
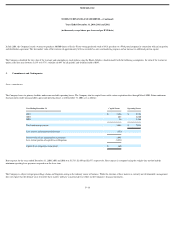
Diluted net loss per share does not include the effect of the following antidilutive common equivalent shares (rounded to nearest thousand):
At December 31, 2002
Weighted Average
Exercise Price2000 2001 2002
Stock options outstanding 1,139,000 2,999,000 4,101,000 $ 3.42
Warrants outstanding 236,000 7,018,000 6,278,000 $ 3.23
Common stock subject to repurchase 509,000 140,000 8,000 $ 2.98
1,884,000 10,157,000 10,387,000 $ 3.31
Redeemable convertible preferred stock 6,772,000 9,660,000 — $ —
Convertible preferred stock 1,859,000 3,123,000 — $ —
10,515,000 22,940,000 10,387,000 $ 3.31
Fair value of financial instruments
The fair value of the Company’s cash, accounts payable and borrowings approximates their carrying values due to their short maturity or fixed−rate structure.
Use of estimates
The preparation of financial statements in conformity with accounting principles generally accepted in the United States of America requires management to make estimates and assumptions
that affect the reported amounts of assets and liabilities and disclosure of contingent assets and liabilities at the date of the financial statements and the reported amounts of revenues and
expenses during the reporting period. Actual results could differ from those estimates.
Segment reporting
The Company is organized in a single operating segment for purposes of making operating decisions and assessing performance. The chief operating decision maker evaluates performance,
makes operating decisions and allocates resources based on financial data consistent with the presentation in the accompanying financial statements.
Recently issued accounting standards
In June 2001, the Financial Accounting Standards Board (“FASB”) issued SFAS No. 143, Accounting for Asset Retirement Obligations . SFAS No. 143 requires the Company to record the
fair value of an asset retirement