NetFlix 2002 Annual Report Download - page 54
Download and view the complete annual report
Please find page 54 of the 2002 NetFlix annual report below. You can navigate through the pages in the report by either clicking on the pages listed below, or by using the keyword search tool below to find specific information within the annual report.-
 1
1 -
2
-
3
-
4
-
5
-
6
-
7
-
8
-
9
-
10
-
11
-
12
-
13
-
14
-
15
-
16
-
17
-
18
-
19
-
20
-
21
-
22
-
23
-
24
-
25
-
26
-
27
-
28
-
29
-
30
-
31
-
32
-
33
-
34
-
35
-
36
-
37
-
38
-
39
-
40
-
41
-
42
-
43
-
 44
44 -
 45
45 -
 46
46 -
 47
47 -
 48
48 -
 49
49 -
 50
50 -
 51
51 -
 52
52 -
 53
53 -
 54
54 -
 55
55 -
 56
56 -
 57
57 -
 58
58 -
 59
59 -
 60
60 -
 61
61 -
 62
62 -
 63
63 -
 64
64 -
65
-
66
-
67
-
68
-
69
-
70
-
71
-
72
-
73
-
74
-
75
-
76
-
77
-
78
-
79
-
80
-
81
-
82
-
83
-
84
-
85
-
86
 |
 |
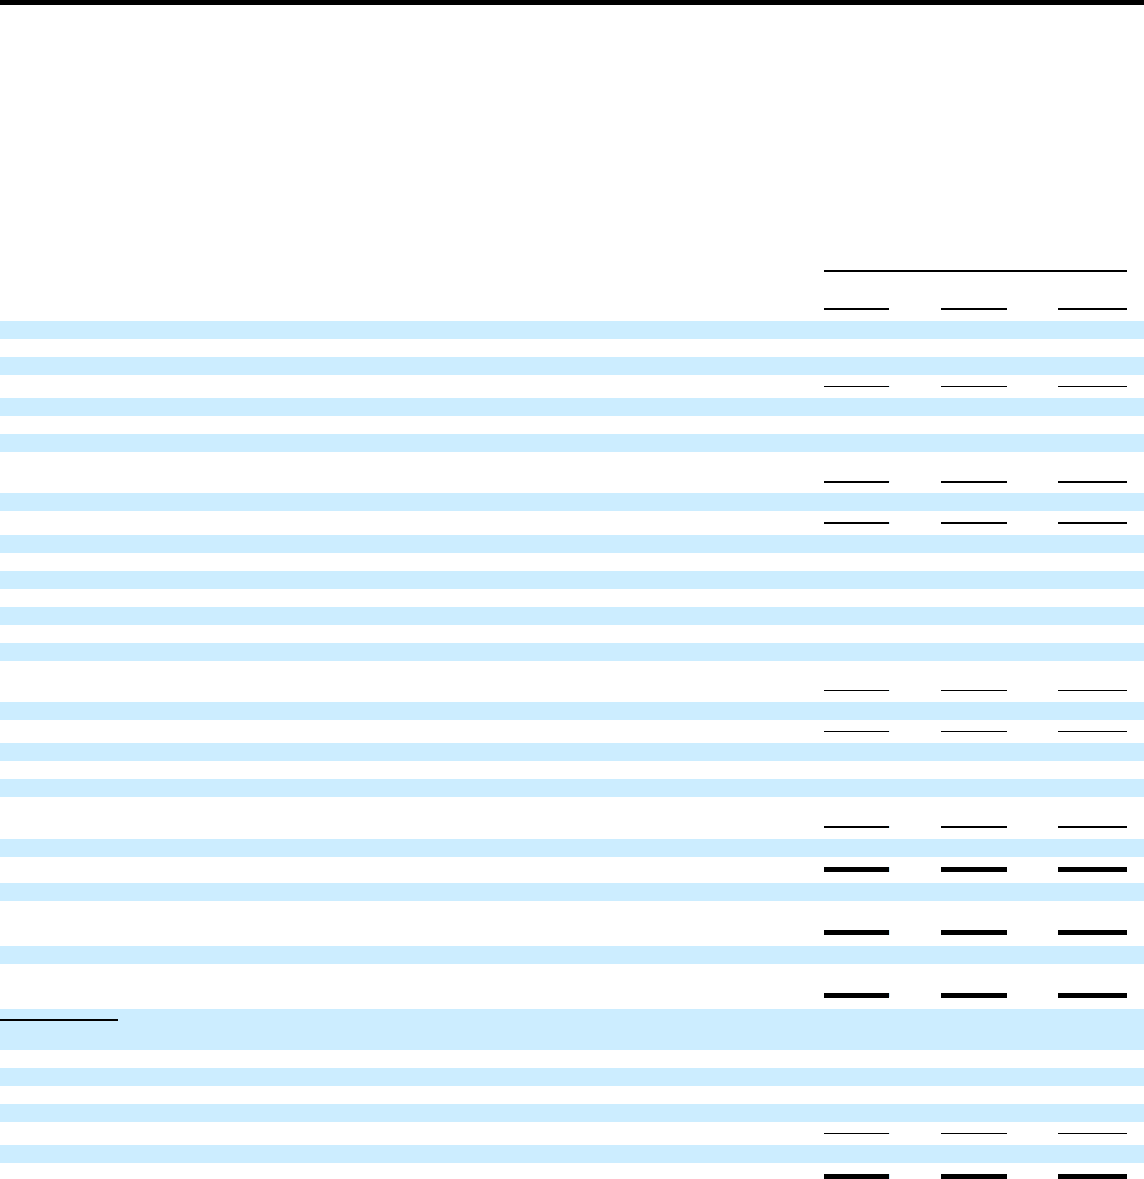
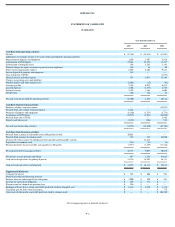
NETFLIX, INC.
STATEMENTS OF OPERATIONS
(in thousands, except per share data)
Year Ended December 31,
2000 2001 2002
Revenues:
Subscription $ 35,894 $ 74,255 $ 150,818
Sales — 1,657 1,988
Total revenues 35,894 75,912 152,806
Cost of revenues:
Subscription 24,861 49,088 77,044
Sales — 819 1,092
Total cost of revenues 24,861 49,907 78,136
Gross profit 11,033 26,005 74,670
Operating expenses:
Fulfillment * 10,247 13,452 19,366
Technology and development * 16,823 17,734 14,625
Marketing * 25,727 21,031 35,783
General and administrative * 6,990 4,658 6,737
Restructuring charges — 671 —
Stock−based compensation * 8,803 5,686 9,831
Total operating expenses 68,590 63,232 86,342
Operating loss (57,557) (37,227) (11,672)
Other income (expense):
Interest and other income 1,645 461 1,697
Interest and other expense (1,451) (1,852) (11,972)
Net loss $ (57,363) $ (38,618) $ (21,947)
Net loss per share:
Basic and diluted $ (40.57) $ (21.15) $ (1.56)
Weighted average shares outstanding:
Basic and diluted 1,414 1,826 14,102
* Amortization of stock−based compensation not included in expense line−item:
Fulfillment $ 2,298 $ 1,200 $ 1,243
Technology and development 2,871 1,932 3,781
Marketing 1,886 1,403 2,482
General and administrative 1,748 1,151 2,325
$ 8,803 $ 5,686 $ 9,831
See accompanying notes to financial statements.
F−4