NetFlix 2002 Annual Report Download - page 19
Download and view the complete annual report
Please find page 19 of the 2002 NetFlix annual report below. You can navigate through the pages in the report by either clicking on the pages listed below, or by using the keyword search tool below to find specific information within the annual report.-
 1
1 -
2
-
3
-
4
-
5
-
6
-
7
-
8
-
 9
9 -
 10
10 -
 11
11 -
 12
12 -
 13
13 -
 14
14 -
 15
15 -
 16
16 -
 17
17 -
 18
18 -
 19
19 -
 20
20 -
 21
21 -
 22
22 -
 23
23 -
 24
24 -
 25
25 -
 26
26 -
 27
27 -
 28
28 -
 29
29 -
30
-
31
-
32
-
33
-
34
-
35
-
36
-
37
-
38
-
39
-
40
-
41
-
42
-
43
-
44
-
45
-
46
-
47
-
48
-
49
-
50
-
51
-
52
-
53
-
54
-
55
-
56
-
57
-
58
-
59
-
60
-
61
-
62
-
63
-
64
-
65
-
66
-
67
-
68
-
69
-
70
-
71
-
72
-
73
-
74
-
75
-
76
-
77
-
78
-
79
-
80
-
81
-
82
-
83
-
84
-
85
-
86
 |
 |

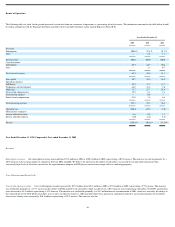
Item 6. Selected Financial Data
The following selected financial data should be read in conjunction with “Management’s Discussion and Analysis of Financial Condition and Results of Operations.” The statement of
operations data set forth below for the years ended December 31, 2002, 2001 and 2000 and the balance sheet data as of December 31, 2002 and 2001 are derived from, and are qualified by
reference to, our financial statements included elsewhere in this Annual Report on Form 10−K. The statement of operations data for the years ended December 31, 1999 and 1998 and the
balance sheet data as of December 31, 2000, 1999 and 1998 are derived from, and are qualified by reference to our financial statements included elsewhere in this Annual Report on Form
10−K.
Statements of Operations Data
(in thousands, except per share data)
Year Ended December 31,
1998 1999 2000 2001 2002
Revenues:
Subscription $ 585 $ 4,854 $ 35,894 $ 74,255 $ 150,818
Sales 754 152 — 1,657 1,988
Total revenues 1,339 5,006 35,894 75,912 152,806
Cost of revenues:
Subscription 535 4,217 24,861 49,088 77,044
Sales 776 156 — 819 1,092
Total cost of revenues 1,311 4,373 24,861 49,907 78,136
Gross profit 28 633 11,033 26,005 74,670
Operating expenses:
Fulfillment 763 2,446 10,247 13,452 19,366
Technology and development 3,857 7,413 16,823 17,734 14,625
Marketing 4,052 14,070 25,727 21,031 35,783
General and administrative 1,358 1,993 6,990 4,658 6,737
Restructuring charges — — — 671 —
Stock−based compensation 1,151 4,742 8,803 5,686 9,831
Total operating expenses 11,181 30,664 68,590 63,232 86,342
Operating loss (11,153) (30,031) (57,557) (37,227) (11,672)
Other income (expense):
Interest and other income 114 924 1,645 461 1,697
Interest and other expense (42) (738) (1,451) (1,852) (11,972)
Net loss $ (11,081) $ (29,845) $ (57,363) $ (38,618) $ (21,947)
Net loss per share:
Basic and diluted $ (36.81) $ (21.41) $ (40.57) $ (21.15) $ (1.56)
Weighted average shares outstanding:
Basic and diluted 301 1,394 1,414 1,826 14,102
10