NetFlix 2002 Annual Report Download - page 25
Download and view the complete annual report
Please find page 25 of the 2002 NetFlix annual report below. You can navigate through the pages in the report by either clicking on the pages listed below, or by using the keyword search tool below to find specific information within the annual report.-
 1
1 -
2
-
3
-
4
-
5
-
6
-
7
-
8
-
9
-
10
-
11
-
12
-
13
-
14
-
 15
15 -
 16
16 -
 17
17 -
 18
18 -
 19
19 -
 20
20 -
 21
21 -
 22
22 -
 23
23 -
 24
24 -
 25
25 -
 26
26 -
 27
27 -
 28
28 -
 29
29 -
 30
30 -
 31
31 -
 32
32 -
 33
33 -
 34
34 -
 35
35 -
36
-
37
-
38
-
39
-
40
-
41
-
42
-
43
-
44
-
45
-
46
-
47
-
48
-
49
-
50
-
51
-
52
-
53
-
54
-
55
-
56
-
57
-
58
-
59
-
60
-
61
-
62
-
63
-
64
-
65
-
66
-
67
-
68
-
69
-
70
-
71
-
72
-
73
-
74
-
75
-
76
-
77
-
78
-
79
-
80
-
81
-
82
-
83
-
84
-
85
-
86
 |
 |

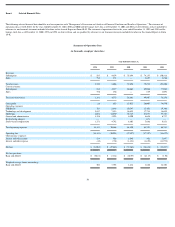
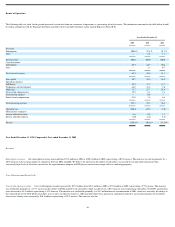
Results of Operations
The following table sets forth, for the periods presented, certain data from our statements of operations as a percentage of total revenues. The information contained in the table below should
be read in conjunction with the Financial Statements and Notes thereto included elsewhere in this Annual Report on Form 10−K.
Year Ended December 31,
2000 2001 2002
Revenues:
Subscription 100.0 % 97.8 % 98.7 %
Sales — 2.2 1.3
Total revenues 100.0 100.0 100.0
Cost of revenues:
Subscription 69.3 64.7 50.4
Sales — 1.1 0.7
Total cost of revenues 69.3 65.8 51.1
Gross profit 30.7 34.2 48.9
Operating expenses:
Fulfillment 28.5 17.7 12.7
Technology and development 46.9 23.4 9.6
Marketing 71.7 27.7 23.4
General and administrative 19.5 6.1 4.4
Restructuring charges — 0.9 —
Stock−based compensation 24.5 7.5 6.4
Total operating expenses 191.1 83.3 56.5
Operating loss (160.4) (49.1) (7.6)
Other income (expense):
Interest and other income 4.6 0.6 1.1
Interest and other expense (4.0) (2.4) (7.8)
Net loss (159.8)% (50.9)% (14.3)%
Year Ended December 31, 2001 Compared to Year ended December 31, 2002
Revenues
Subscription revenues . Our subscription revenues increased from $74.3 million in 2001 to $150.8 million in 2002, representing a 103% increase. This increase was driven primarily by a
103% increase in the average number of subscribers between 2001 and 2002. We believe the increase in the number of subscribers was caused by our unrivalled selection of titles,
consistently high levels of subscriber satisfaction, the rapid consumer adoption of DVD players and our increasingly effective marketing programs.
Cost of Revenues and Gross Profit
Cost of subscription revenues . Cost of subscription revenues increased by $27.9 million from $49.1 million in 2001 to $77.0 million in 2002, representing a 57% increase. This increase
was attributable primarily to a 117% increase in the number of DVDs mailed to our subscribers which was driven by a 104% increase in average paying subscribers. Our DVD amortization
costs decreased by $4.2 million, representing a 21% decrease. The decrease was attributable primarily to a $4.7 million increase in amortization in 2001, which was caused by the change in
the estimated life of our DVD library from three years to one year effective January 1, 2001, partially offset by an increase in amortization related to increased acquisitions for our library.
Our revenue sharing costs increased by $16.8 million, representing a 132% increase. This increase was due
16