NetFlix 2002 Annual Report Download - page 28
Download and view the complete annual report
Please find page 28 of the 2002 NetFlix annual report below. You can navigate through the pages in the report by either clicking on the pages listed below, or by using the keyword search tool below to find specific information within the annual report.-
 1
1 -
2
-
3
-
4
-
5
-
6
-
7
-
8
-
9
-
10
-
11
-
12
-
13
-
14
-
15
-
16
-
17
-
 18
18 -
 19
19 -
 20
20 -
 21
21 -
 22
22 -
 23
23 -
 24
24 -
 25
25 -
 26
26 -
 27
27 -
 28
28 -
 29
29 -
 30
30 -
 31
31 -
 32
32 -
 33
33 -
 34
34 -
 35
35 -
 36
36 -
 37
37 -
 38
38 -
39
-
40
-
41
-
42
-
43
-
44
-
45
-
46
-
47
-
48
-
49
-
50
-
51
-
52
-
53
-
54
-
55
-
56
-
57
-
58
-
59
-
60
-
61
-
62
-
63
-
64
-
65
-
66
-
67
-
68
-
69
-
70
-
71
-
72
-
73
-
74
-
75
-
76
-
77
-
78
-
79
-
80
-
81
-
82
-
83
-
84
-
85
-
86
 |
 |

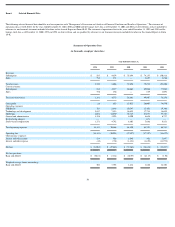
Operating Expenses
Fulfillment . Fulfillment expenses increased from $10.2 million in 2000 to $13.5 million in 2001, representing a 31% increase. This increase was primarily attributable to increases in the
overall volume of the activities of our primary fulfillment center and an increase in credit card fees from $1.6 million in 2000 to $3.2 million in 2001. As a percentage of revenues, fulfillment
expenses decreased from 29% in 2000 to 18% in 2001 primarily due to a combination of an increasing revenue base and improvements in our fulfillment productivity due to our continuous
efforts to refine and streamline our fulfillment operations. Credit card fees increased due to an increase in subscription revenues.
Technology and development . Excluding capitalized software development costs, our technology and development expenses increased from $16.8 million in 2000 to $17.7 million in 2001,
representing a 5% increase. This increase was primarily the result of our investment in storing data, handling large increases in traffic on our Web site and maintaining and modifying our
software related to our Web site, our recommendation service and our internal−software infrastructure. As a percentage of revenues, technology and development expenses decreased from
47% in 2000 to 23% in 2001 primarily due to an increase in subscription revenues.
Marketing . Our marketing expenses decreased from $25.7 million in 2000 to $21.0 million in 2001, representing an 18% decrease. This decrease was primarily attributable to scaling back
the number of free trial offers for part of 2001 and a reduction in our free trial offer period of 30 days to typically 14 days for the balance of 2001. As a percentage of revenues, marketing
expenses decreased from 72% in 2000 to 28% in 2001 primarily due to an increase in subscription revenues.
General and administrative . Our general and administrative expenses decreased from $7.0 million in 2000 to $4.7 million in 2001, representing a 33% decrease. This decrease was
primarily attributable to our cost containment efforts in 2001 and the $1.3 million one−time cost of our withdrawn public offering in 2000. As a percentage of revenues, general and
administrative expenses decreased from 20% in 2000 to 6% in 2001 primarily due to an increase in subscription revenues.
Restructuring . In 2001, we recorded a restructuring expense of $0.7 million relating to severance payments made to 45 employees we terminated in an effort to restructure our organization
to streamline our processes and reduce expenses. We had no restructuring expense in prior years.
Stock−based compensation. Our stock−based compensation expenses decreased from $8.8 million in 2000 to $5.7 million in 2001, representing a 35% decrease. This decrease was
primarily attributable to reduced charges caused by utilization of the graded vesting method of stock compensation amortization and fewer options issued at exercise prices below the fair
value of our common stock.
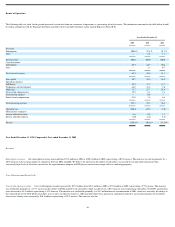
Interest and Other Income (Expense), Net
We had interest and other income, net of $0.2 million in 2000 and interest and other expense, net of ($1.4 million) in 2001. The change between 2000 and 2001 was attributable primarily to a
decrease in interest income caused by a decrease in our interest bearing cash balances and additional interest charges caused by the issuance of subordinated notes payable with a face amount
of $13.0 million.
Liquidity and Capital Resources
Since inception, we have financed our activities primarily through a series of private placements of convertible preferred stock, subordinated promissory notes and our initial public offering.
As of December 31, 2002, we had cash and cash equivalents of $59.8 million and short−term investments of $43.8 million. Although we currently anticipate that the proceeds from our May
2002 public offering, together with our available funds and cash flow from operations, will be sufficient to meet our cash needs for the foreseeable future, we may require additional
financing. Our ability to obtain financing will depend, among other things, on our development
19