Mazda 2015 Annual Report Download - page 62
Download and view the complete annual report
Please find page 62 of the 2015 Mazda annual report below. You can navigate through the pages in the report by either clicking on the pages listed below, or by using the keyword search tool below to find specific information within the annual report.-
 1
1 -
2
-
3
-
4
-
5
-
6
-
7
-
8
-
9
-
10
-
11
-
12
-
13
-
14
-
15
-
16
-
17
-
18
-
19
-
20
-
21
-
22
-
23
-
24
-
25
-
26
-
27
-
28
-
29
-
30
-
31
-
32
-
33
-
34
-
35
-
36
-
37
-
38
-
39
-
40
-
41
-
42
-
43
-
44
-
45
-
46
-
47
-
48
-
49
-
50
-
51
-
 52
52 -
 53
53 -
 54
54 -
 55
55 -
 56
56 -
 57
57 -
 58
58 -
 59
59 -
 60
60 -
 61
61 -
 62
62 -
 63
63 -
 64
64 -
 65
65 -
 66
66
 |
 |

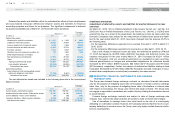
Millions of yen
Reportable segments
Adjustment (*1) Consolidated (*2)
For the year ended March 31, 2014 Japan
North
America Europe Other areas Total
Net sales:
Outside customers ¥ 925,638 ¥832,105 ¥529,100 ¥405,395 ¥2,692,238 ¥ — ¥2,692,238
Inter-segment 1,337,632 11,529 11,432 8,794 1,369,387 (1,369,387) —
Total 2,263,270 843,634 540,532 414,189 4,061,625 (1,369,387) 2,692,238
Segment income 173,500 1,324 8,466 5,803 189,093 (6,972) 182,121
Segment assets 1,791,383 406,254 195,196 195,481 2,588,314 (342,278) 2,246,036
Other items:
Depreciation and amortization 50,543 2,694 3,282 1,109 57,628 — 57,628
Amortization of goodwill 28 — — — 28 — 28
Investments in affiliated companies on the equity method 17,005 42,473 3,748 70,993 134,219 — 134,219
Increase in property, plant and equipment and intangible assets 70,302 54,394 1,519 7,001 133,216 — 133,216
(*1) Notes on adjustment:
(1) The adjustment on segment income are eliminations of inter-segment transactions.
(2) The adjustment on segment assets are mainly eliminations of inter-segment receivables and payables.
(*2) Segment income is reconciled with the operating income in the consolidated statements of income for the years ended March 31, 2015 and 2014.
Segment assets are reconciled with the total assets in the consolidated balance sheets for the years ended March 31, 2015 and 2014.
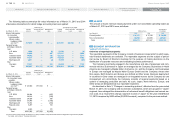
Associated information
Information by geographic areas
The sales information by geographic areas as of March 31, 2015 and 2014 were as follows:
Millions of yen
Thousands of
U.S. dollars
For the years ended March 31 2015 2014 2015
Japan ¥ 617,397 ¥ 655,716 $ 5,144,975
North America 1,022,247 834,803 8,518,725
Europe 613,367 534,937 5,111,392
Other areas 780,888 666,782 6,507,400
Total ¥3,033,899 ¥2,692,238 $25,282,492
Sales is categorized into the countries or regions based on the customers’ locations.
18 RELATED PARTY TRANSACTIONS
There were no transactions with related parties to be disclosed during the years ended
March 31, 2015 and 2014.
Mazda Annual Report 2015
60
C
CONTENTS
Growth Strategy
Message from Management
Introduction
Review of Operations
Foundations Underpinning
Sustainable Growth