Mazda 2015 Annual Report Download - page 38
Download and view the complete annual report
Please find page 38 of the 2015 Mazda annual report below. You can navigate through the pages in the report by either clicking on the pages listed below, or by using the keyword search tool below to find specific information within the annual report.-
 1
1 -
2
-
3
-
4
-
5
-
6
-
7
-
8
-
9
-
10
-
11
-
12
-
13
-
14
-
15
-
16
-
17
-
18
-
19
-
20
-
21
-
22
-
23
-
24
-
25
-
26
-
27
-
 28
28 -
 29
29 -
 30
30 -
 31
31 -
 32
32 -
 33
33 -
 34
34 -
 35
35 -
 36
36 -
 37
37 -
 38
38 -
 39
39 -
 40
40 -
 41
41 -
 42
42 -
 43
43 -
 44
44 -
 45
45 -
 46
46 -
 47
47 -
 48
48 -
49
-
50
-
51
-
52
-
53
-
54
-
55
-
56
-
57
-
58
-
59
-
60
-
61
-
62
-
63
-
64
-
65
-
66
 |
 |

Management Review and Analysis
March 2015 Fiscal Year Review of
Operations
Operating Environment
The operating environment for the Mazda
Group in the March 2015 fi scal year—the year
ended March 31, 2015—showed many ele-
ments of uncertainty, including slowdowns in
emerging market economies and instability in
foreign exchange markets, but the overall
tone was one of a gradual improvement.
Overseas, although China’s economic growth
slowed, the United States showed a steady
recovery, and the beginning of a rebound was
evident in the European economy as a result
of monetary easing. In Japan, retail consump-
tion remained weak in the wake of an increase
in the consumption tax rate, but the direction
of the economy pointed toward a clear recov-
ery. Against this backdrop, the Mazda Group
pursued structural reforms leveraging its
SKYACTIV TECHNOLOGY, and it worked to
enhance brand value by providing attractive
products and services unique to Mazda.
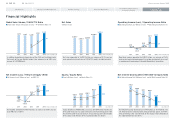
Global Sales Volume
Mazda’s global sales volume in the March 2015
fi scal year rose 5.0% from the previous year,
to 1,397,000 units. In addition to continued
strong sales of the Mazda CX-5 and Mazda3
(Japanese name: Mazda Axela), the new model
of the Mazda2 (Japanese name: Mazda
Demio), which was introduced during the year,
contributed to this growth in sales volume.
By market, sales volume in Japan declined
7.8% from the previous year, to 225,000
units, as a result of the effect of the consump-
tion tax increase, but recent sales have shown
a recovery due to solid sales of the new Demio
and the launch of the new CX-3 in February
2015. Overseas, sales in North America
rose 8.9%, to 425,000 units. Solid sales of
main models, including the CX-5, the Mazda6
(Japanese name: Mazda Atenza), and the
Mazda3, led to sales growth in the United
States, and record sales were registered in
Mexico as well. In Europe, fi rm sales of the
Mazda3 contributed to a 10.8% increase in
sales volume, to 229,000 units, with Mazda’s
sales in the major markets of Germany and
the United Kingdom outpacing the growth of
the overall market. In China, sales grew 9.2%,
to 215,000 units, boosted by the locally pro-
duced CX-5 and Mazda3. In other markets,
although weak demand impacted sales in
some markets such as Thailand, solid sales of
the CX-5 and Mazda3 led to an overall gain of
3.4%, to 303,000 units.
Consolidated wholesales rose 8.1% from the
previous year, to 1,205,000 units.
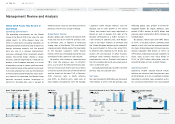
Net Sales
Net sales totaled ¥3,033.9 billion, an increase of
¥341.7 billion, or 12.7%, from the previous year,
refl ecting global sales growth of SKYACTIV-
equipped models. By region, domestic sales
posted a 5.8% decline, to ¥617.4 billion, and
overseas sales registered an 18.7% increase, to
¥2,416.5 billion.
By product, vehicle sales rose ¥319.7 billion,
or 14.7%, to ¥2,500.4 billion, stemming from
growth in unit sales and an improved product
mix. Sales of knockdown parts for overseas pro-
duction expanded ¥8.6 billion, or 12.3%, to
¥79.0 billion, refl ecting increased shipments to
China. Sales of parts rose ¥25.2 billion, or
12.2%, to ¥231.7 billion, while other sales de-
clined ¥11.9 billion, or 5.1%, to ¥222.7 billion.
Operating Income
Operating income totaled ¥202.9 billion,
marking an increase from the previous year
of ¥20.8 billion, or 11.4%. In addition to higher
spending to reinforce sales promotion activi-
ties, increased investments for future growth
Sales Trend by Major Markets
(Thousands of units)
1,397
2011 2012 2013 2014 2015
Other markets
China
Europe
North America
Japan
225
425
229
215
303
1,273 1,247 1,235
206 206 216
1,331
244
391
207
196
293
372
172
175
300
372
183
223
263
342
212
236
277
(Years ended March 31)
3,033.9
2,416.5
617.4
2,325.7
1,784.2
541.5
2,033.1
1,472.9
560.2
2,692.2
2,036.5
655.7
2,205.3
1,617.3
588.0
Net Sales
2011 2012 2013 2014 2015
(Years ended March 31)
158.8
202.9
2011 2012 2013 2014 2015
Operating Income (Loss) / Net Income (Loss)
(60.0) (38.7)
23.8 53.934.3
(107.7)
135.7
182.1
Operating Income (Loss)
Net Income (Loss)
Improvement
Deterioration
(Years ended March 31) (Years ended March 31)
+48.6
+20.8
+17.0 +17.5
(15.0) (47.3)
182.1
202.9
Operating Income Change
2014 2015
Mazda Annual Report 2015
36
C
CONTENTS
Growth Strategy
Message from Management
Introduction
Review of Operations
Foundations Underpinning
Sustainable Growth