Mazda 2015 Annual Report Download - page 39
Download and view the complete annual report
Please find page 39 of the 2015 Mazda annual report below. You can navigate through the pages in the report by either clicking on the pages listed below, or by using the keyword search tool below to find specific information within the annual report.-
 1
1 -
2
-
3
-
4
-
5
-
6
-
7
-
8
-
9
-
10
-
11
-
12
-
13
-
14
-
15
-
16
-
17
-
18
-
19
-
20
-
21
-
22
-
23
-
24
-
25
-
26
-
27
-
28
-
 29
29 -
 30
30 -
 31
31 -
 32
32 -
 33
33 -
 34
34 -
 35
35 -
 36
36 -
 37
37 -
 38
38 -
 39
39 -
 40
40 -
 41
41 -
 42
42 -
 43
43 -
 44
44 -
 45
45 -
 46
46 -
 47
47 -
 48
48 -
 49
49 -
50
-
51
-
52
-
53
-
54
-
55
-
56
-
57
-
58
-
59
-
60
-
61
-
62
-
63
-
64
-
65
-
66
 |
 |
included higher investment for research and
development and fi xed costs for a new plant
in Mexico. Nevertheless, operating income
grew on expanded sales volume and an im-
proved model mix from SKYACTIV-equipped
models, the effects of exchange rate move-
ments, and cost reductions achieved through
Monotsukuri Innovation.
Income before Income Taxes, Net Income
Income before income taxes rose ¥111.9 billion,
or 114.9%, from the previous year, to ¥209.3
billion, including a ¥17.2 billion gain from equity
in net income of affi liates.
After the payment of ¥47.7 billion of
income taxes, net income grew ¥23.1 billion,
or 17.0%, to ¥158.8 billion. Net income per
share was ¥265.64, compared with ¥226.99
in the previous fi scal year.
Segment Information
In Japan, net sales totaled ¥2,528.1 billion, an
increase of ¥264.9 billion, or 11.7%, from the
previous year, with operating income of
¥142.4 billion, which declined ¥31.1 billion, or
17.9%. These results were mainly due to dete-
riorated sales volume and model mix, and
increased R&D expenditures.
Net sales in North America grew ¥412.5
billion, or 48.9%, to ¥1,256.1 billion, with
operating income of ¥37.9 billion, which in-
creased ¥36.6 billion from the previous
period. In addition to full-scale operations
leading to profi tability at the new plant in
Mexico, this result refl ected improved sales
volume and model mix.
In Europe, net sales totaled ¥622.9 billion,
an increase of ¥82.4 billion, or 15.2%, and
¥14.9 billion in operating income, which rose
¥6.5 billion, or 76.3%, mainly from improved
sales volume and model mix.
Net sales in other areas rose ¥69.2 billion,
or 16.7%, to ¥483.4 billion, and operating
income grew ¥7.7 billion, or 132.5%, to ¥13.5
billion, mainly from improved sales volume
and model mix.
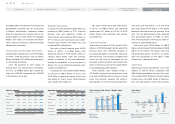
Financial Position
Total assets as of March 31, 2015, were ¥2,473.3
billion, a ¥227.3 billion gain from the end of the
previous fi scal year, refl ecting increases in
cash and time deposits, inventories, and tangi-
ble fi xed assets. The increase in tangible fi xed
assets was the result of investments for the
new plant in Mexico and the new transmission
plant in Thailand, as part of the establishment
of our global production footprint.
Total liabilities were ¥1,582.0 billion, a
¥12.8 billion increase from the previous fi scal
year-end, stemming from an increase in trade
notes and accounts payable. Net interest-
bearing debt, or interest-bearing debt minus
cash and cash equivalents, as of the fi scal
year-end totaled ¥171.9 billion, a ¥91.1 billion
decrease from the end of the previous fi scal
year. The net debt-to-equity ratio improved
20.0 percentage points, to 19.8%, or 15.1%
after the recognition of the equity credit at-
tributes of subordinated loans.
Net assets grew ¥214.5 billion, to ¥891.3
billion, which included the recording of ¥158.8
billion of net income. The equity ratio rose
5.8 percentage points, to 35.2%, or 36.6%
after the recognition of the equity credit
attributes of subordinated loans.
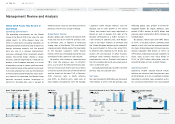
Cash Flows
Operating activities provided net cash in the
amount of ¥204.5 billion, compared with
¥136.4 billion provided in previous fi scal year.
This included ¥209.3 billion of income before
income taxes and ¥68.9 billion of deprecia-
tion and amortization, which were partially
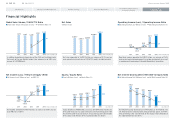
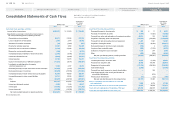
Sales by Segment* (Billions of yen)
(Years ended
March 31) 2011 2012 2013 2014 2015
Japan 1,999.5 1,745.0 1,893.6 2,263.3 2,528.1
North America 631.0 571.6 650.0 843.6 1,256.1
Europe 438.2 360.4 354.8 540.5 622.9
Other markets 310.4 294.2 418.7 414.2 483.4
Adjustment (1,053.4) (938.1) (1,111.8) (1,369.4) (1,856.7)
Consolidated 2,325.7 2,033.1 2,205.3 2,692.2 3,033.9
Operating Income (Loss) by Segment* (Billions of yen)
(Years ended
March 31) 2011 2012 2013 2014 2015
Japan 32.6 (18.4) 108.4 173.5 142.4
North America (31.7) (40.3) (48.9) 1.3 37.9
Europe 7.9 5.6 3.1 8.5 14.9
Other markets 12.8 10.1 16.8 5.8 13.5
Adjustment 2.2 4.3 (25.5) (7.0) (5.8)
Consolidated 23.8 (38.7) 53.9 182.1 202.9
108.9
(95.5)
204.5
2011 2012 2013 2014 2015
Cash Flows
(Billions of yen)
1.6
(79.4)
8.7
(13.7) (9.1)
(70.3)
15.3
49.0
(40.3)
16.3
(120.1)
136.4
891.3
2,473.3
2011 2012 2013 2014 2015
35.2
1,771.8 1,915.9 1,978.6
513.2
474.4
430.5
676.8
2,246.0
29.4
25.1
24.5
24.2
Total Assets / Net Assets / Equity Ratio
(Billions of yen / %)
Total Assets
Net Assets
Equity Ratio
Cash Flow from Operating Activities
Cash Flow from Investing Activities
Free Cash Flow
(As of March 31) (Years ended March 31)
* Net sales by geographic area based on reportable segments * Operating income by geographic area based on reportable segments
Mazda Annual Report 2015
37
C
CONTENTS
Growth Strategy
Message from Management
Introduction
Review of Operations
Foundations Underpinning
Sustainable Growth