Mazda 2015 Annual Report Download - page 15
Download and view the complete annual report
Please find page 15 of the 2015 Mazda annual report below. You can navigate through the pages in the report by either clicking on the pages listed below, or by using the keyword search tool below to find specific information within the annual report.-
 1
1 -
2
-
3
-
4
-
 5
5 -
 6
6 -
 7
7 -
 8
8 -
 9
9 -
 10
10 -
 11
11 -
 12
12 -
 13
13 -
 14
14 -
 15
15 -
 16
16 -
 17
17 -
 18
18 -
 19
19 -
 20
20 -
 21
21 -
 22
22 -
 23
23 -
 24
24 -
 25
25 -
26
-
27
-
28
-
29
-
30
-
31
-
32
-
33
-
34
-
35
-
36
-
37
-
38
-
39
-
40
-
41
-
42
-
43
-
44
-
45
-
46
-
47
-
48
-
49
-
50
-
51
-
52
-
53
-
54
-
55
-
56
-
57
-
58
-
59
-
60
-
61
-
62
-
63
-
64
-
65
-
66
 |
 |

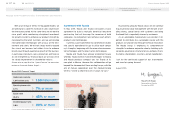
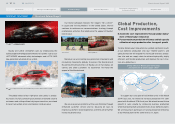
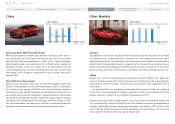
We also intend to address customer needs globally by
increasing flexibility in our production of sedans and SUVs to
maximize production capacity at our major production sites.
As we pursue these initiatives, global human resource
development will play a major role. We are working to cultivate
dependable human resources who are able to make good “big-
picture” judgments and take actions accordingly in areas
including development, production technologies, and quality
control. Our aim is to create an environment and structure in
which employees who understand and share the Mazda vision
are able to stand out and play a role at overseas production sites.
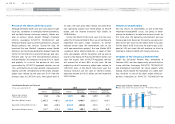
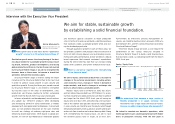
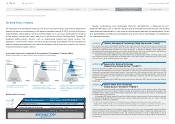
A strong financial base is essential for stable, continuous
growth. As we strengthen our financial base, we intend to raise
the dividend payout in stages. Although increasing equity will
have the effect of decreasing return on equity (ROE), we aim
to maintain ROE at a level of 13% to 15% during the period
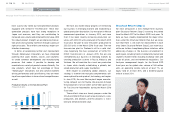
covered by Structural Reform Stage 2. Supported by steady growth in sales volume, we will pursue
qualitative growth through increased business efficiency in
the areas of products, sales, production, and finance, as a
means of accelerating a significant increase in brand value. We
will implement these measures while strengthening the finan-
cial base, as we work to achieve the financial target set for the
March 2019 fiscal year.
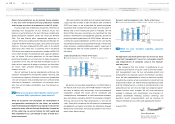
Reinforce Financial
Structure and
Shareholders Returns
50
500
1,000
201520142013 2017
(Forecast)
2018
(Forecast)
2019
(Forecast)
2016
(Forecast)
Equity / Equity Ratio
■ Equity (Billions of yen) (left scale) Equity Ratio (%) (right scale)
(200)
200
0
2017
(Forecast)
2018
(Forecast)
2019
(Forecast)
2016
(Forecast)
201520142013
Net Interest-bearing Debt / Free Cash Flow
■ Net Interest-bearing Debt*
1
(Billions of yen) Free Cash Flow*
2
(Billions of yen)
10
20
30
2
7
23 21
4
13
15
2017
(Forecast)
2018
(Forecast)
2019
(Forecast)
2016
(Forecast)
201520142013
Dividend Payout Ratio / ROE
Dividend Payout Ratio (%) ROE (%)
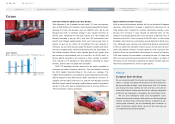
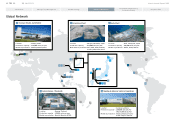
Full capacity
utilization at
overseas
production sites
Maintain domestic
capacity utilization
2012 2013 2019
(Forecast)
2016
(Forecast)
2014 2015
1.23 million
units
1.49 million
units
11%
increase
1.65 million
units
Global Production Volume
■ Domestic Production Volume ■ Overseas Production Volume
New plant in Mexico
Foreign exchange rate assumptions: ¥120 / USD, ¥130 / euro
*1. As of March 31 *2. Years ended March 31
Structural Reform Stage 2
SPECIAL FEATURE
Global sales volume
1.397 million units 1.65 million units
Operating income ratio
6.7% 7% or more
Equity ratio
35.2% 45% or more
Dividend payout ratio
3.8% 20% or more
March 2019 Financial Target
Result for March 2015 fiscal year Target for March 2019 fiscal year
Mazda Annual Report 2015
13
Growth Strategy
(Years ended March 31)
(As of March 31)
(Years ended March 31)
CONTENTS
Foundations Underpinning
Sustainable Growth
Introduction
Review of Operations
Corporate Data
Message from Management