Mazda 2015 Annual Report Download - page 36
Download and view the complete annual report
Please find page 36 of the 2015 Mazda annual report below. You can navigate through the pages in the report by either clicking on the pages listed below, or by using the keyword search tool below to find specific information within the annual report.-
 1
1 -
2
-
3
-
4
-
5
-
6
-
7
-
8
-
9
-
10
-
11
-
12
-
13
-
14
-
15
-
16
-
17
-
18
-
19
-
20
-
21
-
22
-
23
-
24
-
25
-
 26
26 -
 27
27 -
 28
28 -
 29
29 -
 30
30 -
 31
31 -
 32
32 -
 33
33 -
 34
34 -
 35
35 -
 36
36 -
 37
37 -
 38
38 -
 39
39 -
 40
40 -
 41
41 -
 42
42 -
 43
43 -
 44
44 -
 45
45 -
 46
46 -
47
-
48
-
49
-
50
-
51
-
52
-
53
-
54
-
55
-
56
-
57
-
58
-
59
-
60
-
61
-
62
-
63
-
64
-
65
-
66
 |
 |

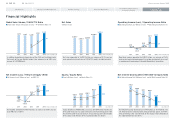
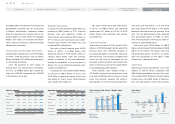
In addition to continued strong sales of the CX-5 and the Mazda3 with
the launch of the new Mazda2, global sales volume was up 5.0% year
on year, at 1,397,000 units.
Net income amounted to ¥158.8 billion, an increase of 17.0% year on
year. ROE was at 20.8%.
Net sales amounted to ¥3,033.9 billion, an increase of 12.7% year on
year, owing to increased sales of SKYACTIV models in global markets.
Equity amounted to ¥869.6 billion, an increase of ¥208.9 billion from the end
of the prior fiscal year. The equity ratio increased 5.8 percentage points from
the end of the prior fiscal year, to 35.2%. (The percentage after consideration
of the equity credit attributes of the subordinated loan was 36.6%.)
Operating income amounted to ¥202.9 billion, an increase of 11.4%
year on year, owing to improvements in volume and product mix as well
as ongoing cost improvements through Monotsukuri Innovation.
Net interest-bearing debt decreased ¥91.1 billion, to ¥171.9 billion. The
net debt-to-equity ratio improved 20.0 percentage points, to 19.8%.
(The percentage after consideration of the equity credit attributes of
the subordinated loan was 15.1%.)
Financial Highlights
1,247
1,273 1,235 1,331 1,397
20122011 2013 2014 2015
31
51
74
(12.8)
(24.0)
(107.7)
(60.0)
34.3
7.1
23.5 20.8
135.7 158.8
20122011 2013 2014 2015
2,0 33.1
2,325.7 2,205.3
2,692.2
3,033.9
20122011 2013 2014 2015
24.5
24.2 25.1 29.4
35.2
468.9
428.8
496.3
660.7
869.6
20122011 2013 2014 2015
(1.9)
1.0 2.4
6.8 6.7
(38.7)
23.8
53.9
182.1 202.9
20122011 2013 2014 2015
64.2
86.3
55.2
39.8
19.8
300.8
370.2
274.1 263.0
171.9
20122011 2013 2014 2015
Global Sales Volume / SKYACTIV Ratio
■ Global Sales Volume (Thousands of units) SKYACTIV Ratio (%)
Net Income (Loss) / Return on Equity (ROE)
■ Net Income (Loss) (Billions of yen) ROE (%)
Net Sales
(Billions of yen)
Equity / Equity Ratio
■ Equity (Billions of yen) Equity Ratio (%)
Operating Income (Loss) / Operating Income Ratio
■ Operating Income (Loss) (Billions of yen) Operating Income Ratio (%)
Net Interest-bearing Debt / Net Debt-to-equity Ratio
■ Net Interest-bearing Debt (Billions of yen) Net Debt-to-equity Ratio (%)
(Years ended March 31)
(Years ended March 31)
(Years ended March 31)
(As of March 31)
(Years ended March 31)
(As of March 31)
Mazda Annual Report 2015
34
C
CONTENTS
Growth Strategy
Message from Management
Introduction
Review of Operations
Foundations Underpinning
Sustainable Growth