Mazda 2015 Annual Report Download - page 40
Download and view the complete annual report
Please find page 40 of the 2015 Mazda annual report below. You can navigate through the pages in the report by either clicking on the pages listed below, or by using the keyword search tool below to find specific information within the annual report.-
 1
1 -
2
-
3
-
4
-
5
-
6
-
7
-
8
-
9
-
10
-
11
-
12
-
13
-
14
-
15
-
16
-
17
-
18
-
19
-
20
-
21
-
22
-
23
-
24
-
25
-
26
-
27
-
28
-
29
-
 30
30 -
 31
31 -
 32
32 -
 33
33 -
 34
34 -
 35
35 -
 36
36 -
 37
37 -
 38
38 -
 39
39 -
 40
40 -
 41
41 -
 42
42 -
 43
43 -
 44
44 -
 45
45 -
 46
46 -
 47
47 -
 48
48 -
 49
49 -
 50
50 -
51
-
52
-
53
-
54
-
55
-
56
-
57
-
58
-
59
-
60
-
61
-
62
-
63
-
64
-
65
-
66
 |
 |

offset by the payment of income taxes and a
decrease in working capital from an increase
in inventories.
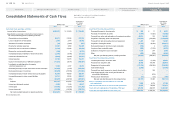
Investing activities used net cash in the
amount of ¥95.5 billion, compared with ¥120.1
billion used in the previous fi scal year. The
main component of this net outfl ow was
¥123.4 billion of outlays for the acquisition of
tangible fi xed assets, including capital invest-
ment for the new plant in Mexico and the new
transmission plant in Thailand.
As a result, consolidated free cash fl ow
was positive in the amount of ¥108.9 billion,
compared with a ¥16.3 billion positive free
cash fl ow in the previous fi scal year. The
Company was able to generate more than
¥100.0 billion of consolidated free cash fl ow
while maintaining a high level of capital in-
vestment for future growth.
Financing activities used net cash in the
amount of ¥62.8 billion, mainly from the
repayment of long-term loans payable, com-
pared with ¥10.5 billion generated in the
previous fi scal year.
Basic Dividend Policy, Dividends for
March 2015 and March 2016 Fiscal Years
Mazda’s basic policy regarding the stock
dividend is to determine the dividend by com-
prehensively taking into account factors
including fi nancial results for the fi scal year,
the business environment, and the Company’s
fi nancial position, while striving to maintain
stable shareholder returns with steady future
increases.
A dividend of ¥10 per share was paid for
the March 2015 fi scal year, and for the March
2016 fi scal year we intend to increase the
dividend by ¥20 per share, to a full-year divi-
dend of ¥30 per share, comprising an interim
dividend of ¥15 per share and a year-end divi-
dend of ¥15 per share.
Mazda intends to use internal reserves for
research and development and capital invest-
ment for future growth.
Forecast for March 2016 Fiscal Year
Although the global economy is expected to
show a gradual recovery, positioning ahead of
a review of U.S. monetary policy, economic
trends in emerging economies, and fl uctua-
tions in exchange rates and crude oil prices
represent elements of continued uncertainty
regarding the outlook for Mazda’s operating
environment. Against this backdrop, the
Company will continue to implement structural
reforms leveraging SKYACTIV TECHNOLOGY
and further enhance brand value in the March
2016 fi scal year, the fi nal year under the
Structural Reform Plan.
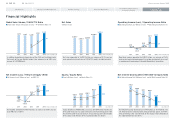
We are projecting a 6.6% increase in
global sales volume in the March 2016 fi scal
year, to 1,490,000 units. By market, we are
forecasting a 6.9% increase in Japan, to
240,000 units; a 5.6% increase in North
America, to 449,000 units; a 4.7% increase in
Europe, to 240,000 units; a 2.5% increase in
China, to 220,000 units; and a 12.3% increase
in other markets, to 341,000 units.
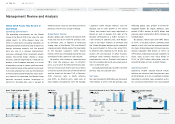
Our projections for consolidated fi nancial
results are for a 7.1% increase in net sales, to
¥3,250.0 billion; a 3.5% increase in operating
income, to ¥210.0 billion; and an 11.8% decline
in net income, to ¥140.0 billion. Our exchange
rate assumptions for the March 2016 fi scal
year are ¥120 to the U.S. dollar and ¥130 to
the euro.
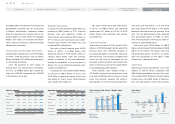
Forecast for the March 2016 Fiscal Year
(Billions of yen)
(Years ended
March 31) 2015 2016 (Forecast) Difference
Net sales 3,033.9 3,250.0 216.1
Operating
income 202.9 210.0 7.1
Net income 158.8 140.0 (18.8)
(Exchange
assumptions)
US$/Yen 110 120
€/Yen 139 130
Forecast for Global Sales Volume (Thousands of units)
(Years ended
March 31) 2015 2016 (Forecast) Difference
Japan 225 240 15
North
America 425 449 24
Europe 229 240 11
China 215 220 5
Other markets 303 341 38
Total 1,397 1,490 93
Mazda Annual Report 2015
38
C
CONTENTS
Growth Strategy
Message from Management
Introduction
Review of Operations
Foundations Underpinning
Sustainable Growth