Mazda 2015 Annual Report Download - page 56
Download and view the complete annual report
Please find page 56 of the 2015 Mazda annual report below. You can navigate through the pages in the report by either clicking on the pages listed below, or by using the keyword search tool below to find specific information within the annual report.-
 1
1 -
2
-
3
-
4
-
5
-
6
-
7
-
8
-
9
-
10
-
11
-
12
-
13
-
14
-
15
-
16
-
17
-
18
-
19
-
20
-
21
-
22
-
23
-
24
-
25
-
26
-
27
-
28
-
29
-
30
-
31
-
32
-
33
-
34
-
35
-
36
-
37
-
38
-
39
-
40
-
41
-
42
-
43
-
44
-
45
-
 46
46 -
 47
47 -
 48
48 -
 49
49 -
 50
50 -
 51
51 -
 52
52 -
 53
53 -
 54
54 -
 55
55 -
 56
56 -
 57
57 -
 58
58 -
 59
59 -
 60
60 -
 61
61 -
 62
62 -
 63
63 -
 64
64 -
 65
65 -
 66
66
 |
 |

Millions of yen
Thousands of
U.S. dollars
For the years ended March 31 2015 2014 2015
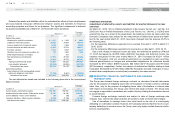
Movements in plan assets:
Balance at beginning of year ¥233,516
¥210,382
$1,945,967
Expected return on plan assets 4,579
4,157
38,158
Actuarial gains/(losses) 13,602
13,442
113,350
Contributions paid by the employer 12,961
17,011
108,008
Benefits paid (12,515)
(12,671)
(104,292)
Other 2,763
1,195
23,026
Balance at end of year ¥254,906
¥233,516
$2,124,217
The reconciliation of the retirement benefit obligations and plan assets to the liability
and asset for retirement benefits recognized in the consolidated balance sheets of March
31, 2015 and 2014 were as follows:
Millions of yen
Thousands of
U.S. dollars
As of March 31 2015 2014 2015
Funded retirement benefit obligations ¥294,389
¥ 288,762
$2,453,242
Plan assets (254,906)
(233,516)
(2,124,217)
Subtotal 39,483
55,246
329,025
Unfunded retirement benefit obligations 19,863
12,857
165,525
Total net liability (asset) for retirement benefits
recognized in consolidated balance sheets 59,346
68,103
494,550
Liability for retirement benefits 62,669
70,149
522,242
Asset for retirement benefits (3,323)
(2,046)
(27,692)
Total net liability (asset) for retirement benefits
recognized in consolidated balance sheets ¥ 59,346
¥ 68,103
$ 494,550
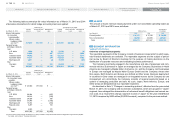
The profits and losses related to retirement benefits for the years ended March 31,
2015 and 2014 were as follows:
Millions of yen
Thousands of
U.S. dollars
For the years ended March 31 2015 2014 2015
Service cost ¥ 9,900
¥10,417
$ 82,500
Interest cost 4,611
4,694
38,425
Expected return on plan assets (4,579)
(4,157)
(38,158)
Net actuarial loss amortization 6,429
8,413
53,575
Past service costs amortization (3,132)
(2,637)
(26,100)
Other 3,358
770
27,983
Severance and retirement benefit expenses ¥16,587
¥17,500
$138,225
Note: For the years ended March 31, 2015 and 2014, accrued pension costs related to defined contribution plans were charged to income as
¥3,298 million ($27,483 thousand) and ¥3,397 million, respectively. This cost is not included in the above.
The breakdown of items of adjustments for retirement benefit (before tax) recognized in
other comprehensive income for the years ended March 31, 2015 and 2014 were as follows:
Millions of yen
Thousands of
U.S. dollars
For the years ended March 31 2015 2014 2015
Past service costs ¥ (3,132)
¥ 15
$(26,100)
Actuarial differences 6,987
2,240
58,225
Other (2)
(3)
(17)
Total ¥ 3,853
¥2,252
$ 32,108
The breakdown of items of accumulated adjustments for retirement benefit (before tax)
recognized in accumulated other comprehensive income as of March 31, 2015 and 2014
were as follows:
Millions of yen
Thousands of
U.S. dollars
As of March 31 2015 2014 2015
Past service costs that are yet to be recognized ¥ 11,096
¥ 14,228
$ 92,467
Actuarial gains and losses that are yet to
be recognized (15,489)
(22,476)
(129,075)
Other 8
10
67
Total ¥ (4,385)
¥ (8,238)
$ (36,541)
The breakdown of plan assets by major category as of March 31, 2015 and 2014 were
as follows:
As of March 31 2015 2014
Bonds 41%
40%
Equity securities 29%
27%
General accounts of the life insurance companies 17%
18%
Other 13%
15%
Total 100%
100%
The major items of actuarial assumptions for the years ended March 31, 2015 and 2014
were as follows:
For the years ended March 31 2015 2014
Discount rate Primarily 1.1%
Primarily 1.3%
Long-term expected rate of return Primarily 1.5%
Primarily 1.5%
Mazda Annual Report 2015
54
C
CONTENTS
Growth Strategy
Message from Management
Introduction
Review of Operations
Foundations Underpinning
Sustainable Growth