Mazda 2015 Annual Report Download - page 52
Download and view the complete annual report
Please find page 52 of the 2015 Mazda annual report below. You can navigate through the pages in the report by either clicking on the pages listed below, or by using the keyword search tool below to find specific information within the annual report.-
 1
1 -
2
-
3
-
4
-
5
-
6
-
7
-
8
-
9
-
10
-
11
-
12
-
13
-
14
-
15
-
16
-
17
-
18
-
19
-
20
-
21
-
22
-
23
-
24
-
25
-
26
-
27
-
28
-
29
-
30
-
31
-
32
-
33
-
34
-
35
-
36
-
37
-
38
-
39
-
40
-
41
-
 42
42 -
 43
43 -
 44
44 -
 45
45 -
 46
46 -
 47
47 -
 48
48 -
 49
49 -
 50
50 -
 51
51 -
 52
52 -
 53
53 -
 54
54 -
 55
55 -
 56
56 -
 57
57 -
 58
58 -
 59
59 -
 60
60 -
 61
61 -
 62
62 -
63
-
64
-
65
-
66
 |
 |

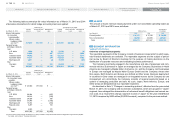
Fair values of financial instruments
As of March 31, 2015 and 2014, the carrying values on the consolidated balance sheet,
the fair values, and the differences between these amounts, respectively, of financial
instruments were as follows. Financial instruments for which fair value is deemed highly
difficult to measure are excluded from the following table.
Millions of yen Thousands of U.S. dollars
As of March 31, 2015
Carrying
values Fair values Difference
Carrying
values Fair values Difference
Assets:
1) Trade notes and
accounts receivable ¥ 215,161 $ 1,793,008
Allowance for
doubtful receivables (*1) (101) (842)
Trade notes and accounts
receivable, net 215,060 ¥ 215,060 ¥ — 1,792,166 $ 1,792,166 $ —
2) Investment securities
Available-for-sale securities 12,760 12,760 — 106,333 106,333 —
3) Long-term loans receivable (*2) 6,390 53,250
Allowance for
doubtful receivables (*3) (2,452) (20,433)
Long-term loans receivable, net 3,938 3,938 — 32,817 32,817 —
Total ¥ 231,758 ¥ 231,758 ¥ — $ 1,931,316 $ 1,931,316 $ —
Liabilities:
1) Trade notes and accounts payable ¥ 379,358 ¥ 379,358 ¥ — $ 3,161,317 $ 3,161,317 $ —
2) Other accounts payable 41,019 41,019 — 341,825 341,825 —
3) Short-term debt 116,677 116,677 — 972,308 972,308 —
4) Long-term debt 584,342 599,374 15,032 4,869,517 4,994,784 125,267
Total ¥ 1,121,396 ¥ 1,136,428 ¥ 15,032 $ 9,344,967 $ 9,470,234 $ 125,267
Derivative instruments: (*4)
1) Hedge accounting not applied ¥ 269 ¥ 269 ¥ — $ 2,242 $ 2,242 $ —
2) Hedge accounting applied 1,014 1,014 — 8,450 8,450 —
Total ¥ 1,283 ¥ 1,283 ¥ — $ 10,692 $ 10,692 $ —
Millions of yen
As of March 31, 2014 Carrying values Fair values Difference
Assets:
1) Trade notes and accounts receivable
¥ 180,544
Allowance for doubtful receivables (*1)
(175)
Trade notes and accounts receivable, net
180,369 ¥ 180,369 ¥ —
2) Investment securities
Available-for-sale securities
9,141 9,141 —
3) Long-term loans receivable (*2)
6,829
Allowance for doubtful receivables (*3)
(2,509)
Long-term loans receivable, net
4,320 4,320 —
Total
¥ 193,830 ¥ 193,830 ¥ —
Liabilities:
1) Trade notes and accounts payable
¥ 331,678 ¥ 331,678 ¥ —
2) Other accounts payable
38,469 38,469 —
3) Short-term debt
105,283 105,283 —
4) Long-term debt
637,452 654,766 17,314
Total
¥ 1,112,882 ¥ 1,130,196 ¥17,314
Derivative instruments: (*4)
1) Hedge accounting not applied
¥ (1,046) ¥ (1,046) ¥ —
2) Hedge accounting applied
(1,903) (1,903) —
Total
¥ (2,949) ¥ (2,949) ¥ —
(*1) Allowance for doubtful receivables, which is recognized on the basis of each individual accounts receivable, is deducted.
(*2) Long-term loans receivable include those due within one year, which are included in “other current assets” on the
consolidated balance sheets.
(*3) Allowance for doubtful receivables, which is recognized on the basis of each individual long-term loans receivable, is deducted.
(*4) Receivables and payables resulting from derivative transactions are offset against each other and presented on a net
basis; when a net liability results, the net amount is shown in ( ).
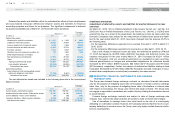
The financial instruments in the following table are excluded from “Assets 2) Investment
securities” in the above tables because measuring the fair value of these instruments is
deemed highly difficult: market prices of these instruments are not available and future
cash flows from these instruments are not contracted.
Millions of yen
Thousands of
U.S. dollars
Carrying values Carrying values
As of March 31 2015 2014 2015
Available-for-sale securities:
Non-listed equity securities ¥ 2,488
¥ 2,321
$ 20,734
Investment securities of affiliated companies 118,977
136,890
991,475
Total ¥121,465
¥139,211
$1,012,209
Mazda Annual Report 2015
50
C
CONTENTS
Growth Strategy
Message from Management
Introduction
Review of Operations
Foundations Underpinning
Sustainable Growth