Mazda 2015 Annual Report Download - page 61
Download and view the complete annual report
Please find page 61 of the 2015 Mazda annual report below. You can navigate through the pages in the report by either clicking on the pages listed below, or by using the keyword search tool below to find specific information within the annual report.-
 1
1 -
2
-
3
-
4
-
5
-
6
-
7
-
8
-
9
-
10
-
11
-
12
-
13
-
14
-
15
-
16
-
17
-
18
-
19
-
20
-
21
-
22
-
23
-
24
-
25
-
26
-
27
-
28
-
29
-
30
-
31
-
32
-
33
-
34
-
35
-
36
-
37
-
38
-
39
-
40
-
41
-
42
-
43
-
44
-
45
-
46
-
47
-
48
-
49
-
50
-
 51
51 -
 52
52 -
 53
53 -
 54
54 -
 55
55 -
 56
56 -
 57
57 -
 58
58 -
 59
59 -
 60
60 -
 61
61 -
 62
62 -
 63
63 -
 64
64 -
 65
65 -
 66
66
 |
 |
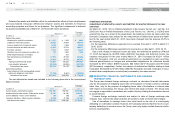
Net sales, income or loss, and assets by reportable segments
Net sales, income or loss, and assets by reportable segments for the years ended March 31, 2015 and 2014 were as follows:
Millions of yen
Reportable segments
Adjustment (*1) Consolidated (*2)
For the year ended March 31, 2015 Japan
North
America Europe Other areas Total
Net sales:
Outside customers ¥ 942,414 ¥1,019,269 ¥606,647 ¥465,569 ¥3,033,899 ¥ — ¥3,033,899
Inter-segment 1,585,731 236,877 16,257 17,811 1,856,676 (1,856,676) —
Total 2,528,145 1,256,146 622,904 483,380 4,890,575 (1,856,676) 3,033,899
Segment income 142,382 37,881 14,925 13,491 208,679 (5,791) 202,888
Segment assets 1,973,969 442,361 209,672 271,156 2,897,158 (423,871) 2,473,287
Other items:
Depreciation and amortization 52,081 11,693 3,863 1,220 68,857 — 68,857
Amortization of goodwill 15 — — — 15 — 15
Investments in affiliated companies on the equity method 20,828 — 2,440 92,676 115,944 — 115,944
Increase in property, plant and equipment and intangible assets 75,706 34,296 2,194 18,814 131,010 — 131,010
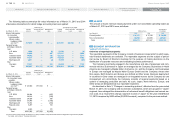
Thousands of U.S. dollars
Reportable segments
Adjustment (*1) Consolidated (*2)
For the year ended March 31, 2015 Japan
North
America Europe Other areas Total
Net sales:
Outside customers $ 7,853,450 $ 8,493,908 $5,055,392 $3,879,742 $25,282,492 $ — $25,282,492
Inter-segment 13,214,425 1,973,975 135,475 148,425 15,472,300 (15,472,300) —
Total 21,067,875 10,467,883 5,190,867 4,028,167 40,754,792 (15,472,300) 25,282,492
Segment income 1,186,517 315,675 124,375 112,425 1,738,992 (48,259) 1,690,733
Segment assets 16,449,742 3,686,342 1,747,267 2,259,633 24,142,984 (3,532,259) 20,610,725
Other items:
Depreciation and amortization 434,008 97,442 32,192 10,167 573,809 — 573,809
Amortization of goodwill 124 — — — 124 — 124
Investments in affiliated companies on the equity method 173,567 — 20,333 772,300 966,200 — 966,200
Increase in property, plant and equipment and intangible assets 630,883 285,800 18,283 156,784 1,091,750 — 1,091,750
Mazda Annual Report 2015
59
C
CONTENTS
Growth Strategy
Message from Management
Introduction
Review of Operations
Foundations Underpinning
Sustainable Growth