Mazda 2010 Annual Report Download - page 71
Download and view the complete annual report
Please find page 71 of the 2010 Mazda annual report below. You can navigate through the pages in the report by either clicking on the pages listed below, or by using the keyword search tool below to find specific information within the annual report.-
 1
1 -
2
-
3
-
4
-
5
-
6
-
7
-
8
-
9
-
10
-
11
-
12
-
13
-
14
-
15
-
16
-
17
-
18
-
19
-
20
-
21
-
22
-
23
-
24
-
25
-
26
-
27
-
28
-
29
-
30
-
31
-
32
-
33
-
34
-
35
-
36
-
37
-
38
-
39
-
40
-
41
-
42
-
43
-
44
-
45
-
46
-
47
-
48
-
49
-
50
-
51
-
52
-
53
-
54
-
55
-
56
-
57
-
58
-
59
-
60
-
 61
61 -
 62
62 -
 63
63 -
 64
64 -
 65
65 -
 66
66 -
 67
67 -
 68
68 -
 69
69 -
 70
70 -
 71
71 -
 72
72 -
 73
73 -
 74
74 -
 75
75 -
 76
76 -
 77
77 -
 78
78
 |
 |

69
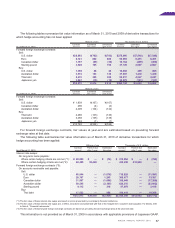
Thousands of U.S. dollars
For the year ended North Elimination
March 31, 2010 Japan America Europe Other areas Total or corporate Consolidated
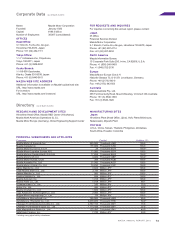
Net sales:
Outside customers $ 9,617,946 $6,086,452 $5,160,118 $2,403,753 $23,268,269 $ — $23,268,269
Inter-segment 10,459,957 64,623 94,559 18,139 10,637,278 (10,637,278) —
Total 20,077,903 6,151,075 5,254,677 2,421,892 33,905,547 (10,637,278) 23,268,269
Costs and expenses 19,746,849 6,358,634 5,216,989 2,364,075 33,686,547 (10,519,977) 23,166,570
Operating income/(loss) $ 331,054 $ (207,559) $ 37,688 $ 57,817 $ 219,000 $ (117,301) $ 101,699
Total identifiable assets $19,625,484 $1,839,280 $2,377,355 $ 663,698 $24,505,817 $ (3,562,064) $20,943,753
Notes: 1) Method of segmentation and principal countries or regions belonging to each segment
a) Method: Segmentation by geographic adjacency
b) Principal countries or regions belonging to each segment
North America ................U.S. and Canada
Europe ............................Germany, Belgium, and U.K.
Other areas ....................Australia, Colombia, and Thailand
2) As discussed earlier in Note 3, commencing in the year ended March 31, 2009, the Company and its consolidated foreign subsidiaries adopted PITF No. 18,
Practical Solution on Unification of Accounting Policies Applied to Foreign Subsidiaries for Consolidated Financial Statements. The effects of adopting
PITF No. 18 on the operating income of the North America segment for the year ended March 31, 2009 were immaterial, but the effects on the Europe segment
and on the Other areas segment were to decrease operating income by ¥2,898 million and to increase operating income by ¥3,125 million, respectively.
Also, in connection with adopting PITF No. 18, incentive expenses of consolidated foreign subsidiaries that were recognized in selling, general and
administrative expenses in the prior periods are now recognized as a reduction to net sales. The effects of this change on the North America segment, Europe
segment, and Other areas segment for the year ended March 31, 2009 were to decrease net sales by ¥73,289 million, ¥62,725 million, and ¥10,683 million,
respectively. However, this change had no effect on operating income of any of the segments as the operating expense (selling, general and administrative
expenses) of each segment decreased by the amount equal to the amount of decrease in net sales.
3) As discussed earlier in Note 3, commencing in the year ended March 31, 2009, the Domestic Companies adopted ASBJ Statement No. 9, Accounting Standards
for Measurement of Inventories. The effect of adopting the new standard on the Japan segment for the year ended March 31, 2009 was to increase operating loss
by ¥2,461 million.
4) As discussed earlier in Note 3, commencing in the year ended March 31, 2009, the Company changed accounting for materials sold to and purchased back from
suppliers after fabrication. The effect of this change on the Japan segment for the year ended March 31, 2009 was to decrease net sales by ¥152,097 million.
However, since operating expense (cost of sales) decreased by the same amount, operating loss was not affected.
5) As discussed earlier in Note 3, commencing in the year ended March 31, 2009, the Domestic Companies changed the useful lives of tangible fixed assets in
calculating their depreciation expenses in accordance with the revised Corporate Tax Code of Japan. The effect of this change on the Japan segment for the year
ended March 31, 2009 was to increase operating loss by ¥2,325 million.
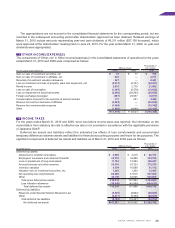
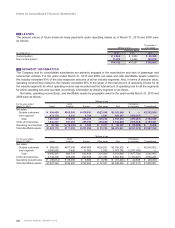
International sales for the years ended March 31, 2010 and 2009 were as follows:
Millions of yen
For the year ended March 31, 2010 North America Europe Other areas Total
International sales ¥574,640 ¥477,337 ¥536,990 ¥1,588,967
Percentage of consolidated net sales 26.5% 22.1% 24.8% 73.4%
Millions of yen
For the year ended March 31, 2009 North America Europe Other areas Total
International sales ¥697,600 ¥653,382 ¥564,584 ¥1,915,566
Percentage of consolidated net sales 27.5% 25.8% 22.2% 75.5%
Thousands of U.S. dollars
For the year ended March 31, 2010 North America Europe Other areas Total
International sales $6,178,925 $5,132,656 $5,774,086 $17,085,667
Notes: 1) International sales include exports by Mazda Motor Corporation and its domestic consolidated subsidiaries as well as sales (other than exports to Japan) by
overseas consolidated subsidiaries.
2) Method of segmentation and principal countries or regions belonging to each segment
a) Method: Segmentation by geographic adjacency
b) Principal countries or regions belonging to each segment
North America ...... U.S. and Canada
Europe ................. Germany, U.K., and Russia
Other areas .......... Australia, China, and Thailand