Mazda 2010 Annual Report Download - page 40
Download and view the complete annual report
Please find page 40 of the 2010 Mazda annual report below. You can navigate through the pages in the report by either clicking on the pages listed below, or by using the keyword search tool below to find specific information within the annual report.-
 1
1 -
2
-
3
-
4
-
5
-
6
-
7
-
8
-
9
-
10
-
11
-
12
-
13
-
14
-
15
-
16
-
17
-
18
-
19
-
20
-
21
-
22
-
23
-
24
-
25
-
26
-
27
-
28
-
29
-
 30
30 -
 31
31 -
 32
32 -
 33
33 -
 34
34 -
 35
35 -
 36
36 -
 37
37 -
 38
38 -
 39
39 -
 40
40 -
 41
41 -
 42
42 -
 43
43 -
 44
44 -
 45
45 -
 46
46 -
 47
47 -
 48
48 -
 49
49 -
 50
50 -
51
-
52
-
53
-
54
-
55
-
56
-
57
-
58
-
59
-
60
-
61
-
62
-
63
-
64
-
65
-
66
-
67
-
68
-
69
-
70
-
71
-
72
-
73
-
74
-
75
-
76
-
77
-
78
 |
 |

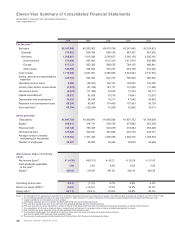
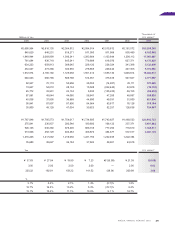
Millions of yen
Thousands of
U.S. dollars*1
2010 2009 2008 2007 2006
For the year*2:
Net sales ¥2,163,949 ¥2,535,902 ¥3,475,789 ¥3,247,485 ¥2,919,823
Domestic 574,982 620,336 880,132 887,327 887,662
Overseas 1,588,967 1,915,566 2,595,657 2,360,158 2,032,161
North America 574,640 697,600 1,015,315 1,017,874 843,988
Europe 477,337 653,382 888,555 789,135 668,941
Other areas 536,990 564,584 691,787 553,149 519,232
Cost of sales 1,710,699 2,021,851 2,485,905 2,322,644 2,110,934
Selling, general and administrative
expenses 443,792 542,432 827,737 766,309 685,454
Operating income (loss) 9,458 (28,381) 162,147 158,532 123,435
Income (loss) before income taxes (7,265) (51,339) 143,117 118,450 117,468
Net income (loss) (6,478) (71,489) 91,835 73,744 66,711
Capital expenditures*329,837 81,838 75,518 79,641 72,070
Depreciation and amortization*476,428 84,043 74,217 47,045 45,805
Research and development costs 85,206 95,967 114,400 107,553 95,730
Free cash flow*567,394 (129,244) 10,209 20,995 33,611
At the year-end:
Total assets ¥1,947,769 ¥1,800,981 ¥1,985,566 ¥1,907,752 ¥1,788,659
Equity*6509,815 414,731 554,154 479,882 407,208
Financial debt 722,128 753,355 504,979 474,684 455,409
Net financial debt 375,825 532,631 281,085 232,179 246,751
Average number of shares
outstanding (in thousands) 1,519,652 1,371,456 1,408,368 1,402,315 1,294,533
Number of employees 38,987 39,852 39,364 38,004 36,626
U.S. dollars*1
Amounts per share of common
stock:
Net income (loss)*7¥ (4.26) ¥(52.13) ¥ 65.21 ¥ 52.59 ¥ 51.53
Cash dividends applicable
to the year*83.00 3.00 6.00 6.00 5.00
Equity*9286.92 314.98 391.82 336.45 284.28
Operating income ratio 0.4 % (1.1)% 4.7% 4.9% 4.2%
Return on equity (ROE)*10 (1.4)% (14.8)% 17.9% 16.9% 20.0%
Equity ratio*10 26.1 % 22.9 % 27.8% 24.8% 22.3%
Notes: 1. The translation of the Japanese yen amounts into U.S. dollars is presented solely for the convenience of readers, using the prevailing exchange rate on March 31, 2010, of ¥93 to US$1.
2. The consolidated operating results for the year ended March 31, 2004 consist of 15 months of operations for the major overseas subsidiaries that changed their fiscal year-ends.
3. Capital expenditures are calculated on an accrual basis.
4. Amortization expenses are not included for the March 2007 fiscal year and preceding fiscal years.
5. Free cash flow represents the sum of net cash flows from operating activities and from investing activities.
6. Prior-year amounts have been reclassified to conform to figures for the March 2007 fiscal year and subsequent fiscal years presentation to include minority interests.
7. The computations of net income (loss) per share of common stock are based on the average number of shares outstanding during each fiscal year.
8. Cash dividends per share represent actual amounts applicable to the respective years.
9. The amounts of equity used in the calculation of equity per share, return on equity, and equity ratio exclude minority interests
(and, from the March 2007 fiscal year, stock acquisition rights).
10. The amounts of equity exclude minority interests (and, from the March 2007 fiscal year, stock acquisition rights).
38