Mazda 2010 Annual Report Download - page 47
Download and view the complete annual report
Please find page 47 of the 2010 Mazda annual report below. You can navigate through the pages in the report by either clicking on the pages listed below, or by using the keyword search tool below to find specific information within the annual report.-
 1
1 -
2
-
3
-
4
-
5
-
6
-
7
-
8
-
9
-
10
-
11
-
12
-
13
-
14
-
15
-
16
-
17
-
18
-
19
-
20
-
21
-
22
-
23
-
24
-
25
-
26
-
27
-
28
-
29
-
30
-
31
-
32
-
33
-
34
-
35
-
36
-
 37
37 -
 38
38 -
 39
39 -
 40
40 -
 41
41 -
 42
42 -
 43
43 -
 44
44 -
 45
45 -
 46
46 -
 47
47 -
 48
48 -
 49
49 -
 50
50 -
 51
51 -
 52
52 -
 53
53 -
 54
54 -
 55
55 -
 56
56 -
 57
57 -
58
-
59
-
60
-
61
-
62
-
63
-
64
-
65
-
66
-
67
-
68
-
69
-
70
-
71
-
72
-
73
-
74
-
75
-
76
-
77
-
78
 |
 |

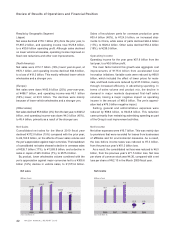
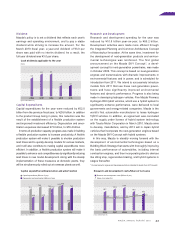
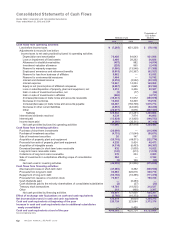
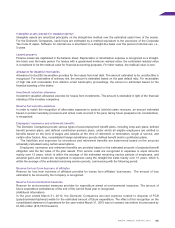
(Cash Flow from Financing Activities)
Financing activities generated net cash in the amount of
¥61.0 billion, primarily from funds procured via long-term
borrowings, the issuance of new shares, and the re-
issuance of treasury stock shares.
Free cash flow—the sum of cash flows from operating
and investing activities—was positive in the amount of
¥67.4 billion for the year.
Fund procurement during the year consisted of ¥78.4
billion in long-term borrowing and ¥93.3 billion from the
capital increase carried out in October and November, 2009.
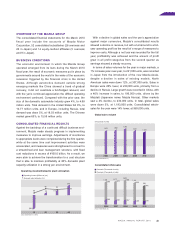
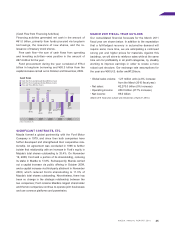
Mazda formed a global partnership with the Ford Motor
Company in 1979, and since then both companies have
further developed and strengthened their cooperative rela-
tionship. An agreement was concluded in 1996 to further
bolster that relationship with an increase in Ford’s equity in
Mazda’s total shares outstanding to 33.4%. On November
19, 2008, Ford sold a portion of its shareholding, reducing
its stake in Mazda to 13.8%. Subsequently, Mazda carried
out a capital increase via public offering in October 2009,
and a capital increase via third-party allotment in November
2009, which reduced Ford’s shareholding to 11.0% of
Mazda’s total shares outstanding. Nevertheless, there has
been no change in the strategic relationship between the
two companies; Ford remains Mazda’s largest shareholder
and the two companies continue to operate joint businesses
and use common platforms and powertrains.
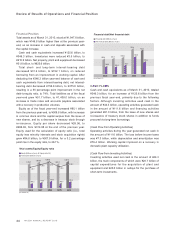
Our consolidated financial forecasts for the March 2011
fiscal year are shown below. In addition to the expectation
that a full-fledged recovery in automotive demand will
require some more time, we are anticipating a continued
strong yen and higher prices for materials. Against this
backdrop, we will strive to reinforce sales while at the same
time aim for profitability in all profit categories, by steadily
working to improve earnings in order to create a more
robust cost structure. Our exchange rate assumptions for
the year are ¥90/U.S. dollar and¥125/euro.
• Global sales volume: 1.27 million units (a 6% increase
from the March 2010 fiscal year)
• Net sales: ¥2,270.0 billion (5% increase)
• Operating income: ¥30.0 billion (217% increase)
• Net income: ¥5.0 billion
(March 2011 fiscal year outlook was released as of April 27, 2010.)
33.6
(81.0)
21.0
(95.4)
10.2
114.6 116.4 103.0
(92.8)
(67.4)(61.8)
(129.2)
111.6
67.4
(44.3)
Cash flow from investing activities (Billions of yen)
Free cash flow (Billions of yen)
Cash flow from operating activities (Billions of yen)
)''- )''. )''/ )''0 )'('
(Years ended March 31)
:Xj_]cfnj
45