Mazda 2010 Annual Report Download - page 44
Download and view the complete annual report
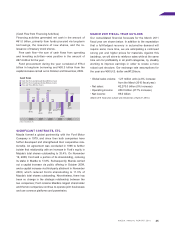
Please find page 44 of the 2010 Mazda annual report below. You can navigate through the pages in the report by either clicking on the pages listed below, or by using the keyword search tool below to find specific information within the annual report.-
 1
1 -
2
-
3
-
4
-
5
-
6
-
7
-
8
-
9
-
10
-
11
-
12
-
13
-
14
-
15
-
16
-
17
-
18
-
19
-
20
-
21
-
22
-
23
-
24
-
25
-
26
-
27
-
28
-
29
-
30
-
31
-
32
-
33
-
 34
34 -
 35
35 -
 36
36 -
 37
37 -
 38
38 -
 39
39 -
 40
40 -
 41
41 -
 42
42 -
 43
43 -
 44
44 -
 45
45 -
 46
46 -
 47
47 -
 48
48 -
 49
49 -
 50
50 -
 51
51 -
 52
52 -
 53
53 -
 54
54 -
55
-
56
-
57
-
58
-
59
-
60
-
61
-
62
-
63
-
64
-
65
-
66
-
67
-
68
-
69
-
70
-
71
-
72
-
73
-
74
-
75
-
76
-
77
-
78
 |
 |

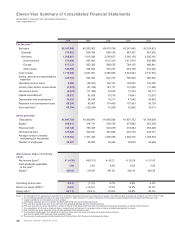
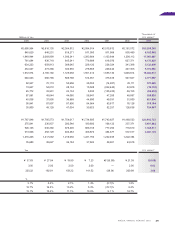
Results by Geographic Segment
(Japan)
Net sales declined ¥178.1 billion (9%) from the prior year, to
¥1,867.2 billion, and operating income rose ¥125.8 billion,
to a ¥30.8 billion operating profit. Although sales declined
on lower vehicle wholesales, operating income improved on
fixed cost reductions and other cost improvements.
(North America)
Net sales were ¥112.7 billion (16%) lower year-to-year, at
¥572.1 billion, and operating income declined ¥44.8 billion,
to a loss of ¥19.3 billion. This mostly reflected lower vehicle
wholesales and a stronger yen.
(Europe)
Net sales were down ¥163.8 billion (25%) year-over-year,
at ¥488.7 billion, and operating income was ¥5.1 billion
(59%) lower, at ¥3.5 billion. The declines were mainly
because of lower vehicle wholesales and a stronger yen.
(Other areas)
Net sales declined ¥5.8 billion (3%) from the last year, to ¥225.2
billion, and operating income was down ¥4.3 billion (45%),
to ¥5.4 billion, primarily as a result of the stronger yen.
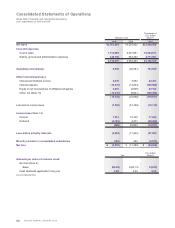
Net Sales
Consolidated net sales for the March 2010 fiscal year
declined ¥372.0 billion (15%) compared with the prior year,
to ¥2,163.9 billion, on the effects of lower sales volume and
the yen’s appreciation against major currencies. The breakdown
of consolidated net sales showed a decline in overseas sales
of ¥326.7 billion (17%), to ¥1,588.9 billion, and a decline in
sales in Japan of ¥45.3 billion (7%), to ¥575.0 billion.
By product, lower wholesales volume combined with the
yen’s appreciation against major currencies led to a ¥308.6
billion (16%) decline in vehicle sales, to ¥1,573.6 billion.
Sales of knockdown parts for overseas production grew
¥35.4 billion (40%), to ¥124.5 billion, on increased ship-
ments to China, while sales of parts declined ¥46.4 billion
(17%), to ¥226.4 billion. Other sales declined ¥52.4 billion
(18%), to ¥239.5 billion.
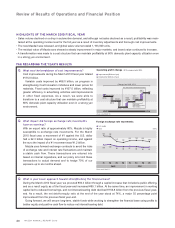
Operating Income
Operating income for the year grew ¥37.8 billion from the
last year, to a ¥9.5 billion profit.
The main factor behind this growth was aggregate cost
improvements of ¥175.0 billion from accelerated Cost
Innovation initiatives. Variable costs were reduced by ¥68.0
billion, which included the effect of lower prices for mate-
rials, and fixed costs were reduced by ¥107.0 billion, mainly
through increased efficiency in advertising spending. In
terms of sales volume and product mix, the decline in
demand in major markets depressed first-half sales
volumes, having a major negative impact on operating
income in the amount of ¥60.6 billion. The yen’s appreci-
ation had a ¥76.5 billion negative impact.
Selling, general and administrative expenses were
reduced by ¥98.6 billion, to ¥443.8 billion. This reduction
came primarily from restraining advertising spending as part
of the Group’s cost improvement activities.
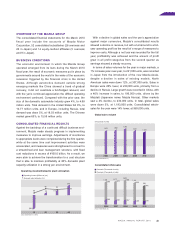
Net Income
Net other expenses were ¥16.7 billion. This was mainly due
to provisions that were recorded for losses from businesses
of affiliates and for environmental measures. As a result,
the loss before income taxes was reduced to ¥7.3 billion,
from the previous year’s ¥51.3 billion loss.
As a result, the consolidated net loss was reduced to ¥6.5
billion, from the previous year’s ¥71.5 billion loss. Net loss
per share of common stock was ¥4.26, compared with a net
loss per share of ¥52.13 in the March 2009 fiscal year.
66.7
91.8
(71.5) (6.5)
73.7
)''- )''. )''/ )''0 )'('
(Billions of yen)
(Years ended March 31)
E\k`eZfd\
2,919.8
3,475.8
2,535.9
2,163.9
3,247.5
(Billions of yen)
)''- )''. )''/ )''0 )'('
(Years ended March 31)
E\kjXc\j
42