Mazda 2010 Annual Report Download - page 42
Download and view the complete annual report
Please find page 42 of the 2010 Mazda annual report below. You can navigate through the pages in the report by either clicking on the pages listed below, or by using the keyword search tool below to find specific information within the annual report.-
 1
1 -
2
-
3
-
4
-
5
-
6
-
7
-
8
-
9
-
10
-
11
-
12
-
13
-
14
-
15
-
16
-
17
-
18
-
19
-
20
-
21
-
22
-
23
-
24
-
25
-
26
-
27
-
28
-
29
-
30
-
31
-
 32
32 -
 33
33 -
 34
34 -
 35
35 -
 36
36 -
 37
37 -
 38
38 -
 39
39 -
 40
40 -
 41
41 -
 42
42 -
 43
43 -
 44
44 -
 45
45 -
 46
46 -
 47
47 -
 48
48 -
 49
49 -
 50
50 -
 51
51 -
 52
52 -
53
-
54
-
55
-
56
-
57
-
58
-
59
-
60
-
61
-
62
-
63
-
64
-
65
-
66
-
67
-
68
-
69
-
70
-
71
-
72
-
73
-
74
-
75
-
76
-
77
-
78
 |
 |

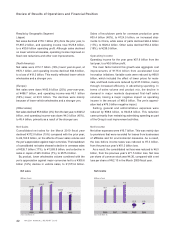
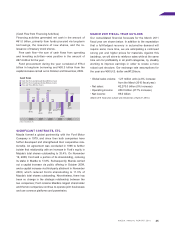
Q. What impact did foreign exchange rate movements
have on earnings?
With an export ratio of approximately 80%, Mazda is highly
susceptible to exchange rate movements. For the March
2010 fiscal year, a movement of ¥1 against the U.S. dollar
had a ¥2.3 billion impact on operating income, and against
the euro the impact of a ¥1 movement was ¥1.2 billion.
Mazda uses forward exchange contracts to avoid the risks
of exchange rate and interest rate fluctuations and maintain
a stable cash flow. These transactions are entered into
based on internal regulations, and our policy is to limit these
transactions to actual demand and to hedge 70% of our
exposure up to six months ahead.
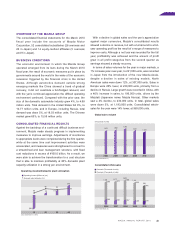
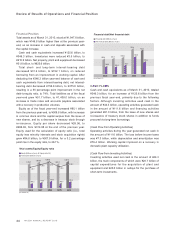
• Sales volume declined on a drop in automotive demand, and although net sales declined as a result, profitability was main-
tained at the operating income level for the full year as a result of inventory adjustments and thorough cost improvements.
• The new Mazda3 was released, and global sales volume totaled 1,193,000 units.
• The residual value of Mazda cars showed a steady improvement in major markets, and brand value continued to increase.
• A transformation was made to a cost structure that can maintain profitability at 80% domestic plant capacity utilization even
in a strong yen environment.
(28.4) +68.0
+22.7
+84.3 9.5
(60.6)
(76.5)
)''0 )'('
(Years ended March 31)
Improvement (Billions of yen)
Deterioration (Billions of yen)
2010 compared with 2009
Change from 2009 +37.8
Volume & Mix
Foreign
Exchange Variable
Costs
Cost improvement totaled ¥175.0 billion
Fixed costs
improvement totaled
¥107.0 billion
Marketing
Expenses
Others
Fg\iXk`e^gif]`kZ_Xe^\
Q. What was the breakdown of cost improvements?
Cost improvements during the March 2010 fiscal year totaled
¥175.0 billion.
Variable costs improved by ¥68.0 billion, on progress in
strengthening Cost Innovation initiatives and lower prices for
materials. Fixed costs improved by ¥107.0 billion, reflecting
greater efficiency in advertising activities and improvements
in other fixed expenses. As a result, we were able to
transform to a cost structure that can maintain profitability at
80% domestic plant capacity utilization even in a strong yen
environment.
163
105
162
108
127
96
122
94
133
97
134
94
133
90
126
91
U.S. dollar
Euro (Yen)
)''0 )'('
(H )H *H +H (H )H *H +H
(Years ended March 31)
=fi\`^e\oZ_Xe^\iXk\dfm\d\ekj
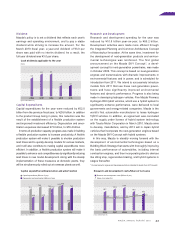
Q. What is your basic approach toward strengthening the financial base?
During the March 2010 fiscal year, we procured ¥93.3 billion through a capital increase that included a public offering,
and as a result equity as of the fiscal year-end increased ¥95.1 billion. At the same time, an improvement in working
capital led to reduced borrowings, and net interest-bearing debt declined ¥156.8 billion from the previous fiscal year-
end. As a result, the net debt-to-equity ratio at the end of the year stood at 74%, a major 55 percentage point
improvement from the previous fiscal year-end.
Going forward, we will secure long-term, stable funds while working to strengthen the financial base using profits to
bolster equity and positive cash flow to reduce net interest-bearing debt.
40