Mazda 2010 Annual Report Download - page 70
Download and view the complete annual report
Please find page 70 of the 2010 Mazda annual report below. You can navigate through the pages in the report by either clicking on the pages listed below, or by using the keyword search tool below to find specific information within the annual report.-
 1
1 -
2
-
3
-
4
-
5
-
6
-
7
-
8
-
9
-
10
-
11
-
12
-
13
-
14
-
15
-
16
-
17
-
18
-
19
-
20
-
21
-
22
-
23
-
24
-
25
-
26
-
27
-
28
-
29
-
30
-
31
-
32
-
33
-
34
-
35
-
36
-
37
-
38
-
39
-
40
-
41
-
42
-
43
-
44
-
45
-
46
-
47
-
48
-
49
-
50
-
51
-
52
-
53
-
54
-
55
-
56
-
57
-
58
-
59
-
 60
60 -
 61
61 -
 62
62 -
 63
63 -
 64
64 -
 65
65 -
 66
66 -
 67
67 -
 68
68 -
 69
69 -
 70
70 -
 71
71 -
 72
72 -
 73
73 -
 74
74 -
 75
75 -
 76
76 -
 77
77 -
 78
78
 |
 |

68
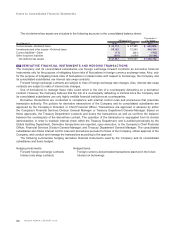
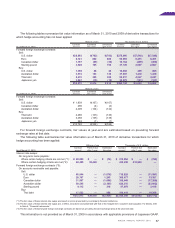
The present values of future minimum lease payments under operating leases as of March 31, 2010 and 2009 were
as follows:
Thousands of
Millions of yen U.S. dollars
Operating leases
As of March 31 2010 2009 2010
Current portion ¥ 2,464 ¥ 2,852 $ 26,495
Non-current portion 11,678 13,845 125,570
¥14,142 ¥16,697 $152,065
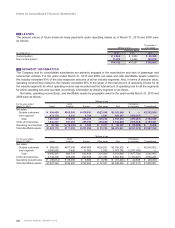
The Company and its consolidated subsidiaries are primarily engaged in the manufacture and sale of passenger and
commercial vehicles. For the years ended March 31, 2010 and 2009, net sales and total identifiable assets related to
this industry exceeded 90% of the total respective amounts of all the industry segments. Also, in terms of absolute value,
operating income/(loss) related to this industry exceeded 90% of the larger of the total amount of operating income for all
the industry segments for which operating income was recorded and the total amount of operating loss for all the segments
for which operating loss was recorded. Accordingly, information by industry segment is not shown.
Net sales, operating income/(loss), and identifiable assets by geographic area for the years ended March 31, 2010 and
2009 were as follows:
Millions of yen
For the year ended North Elimination
March 31, 2010 Japan America Europe Other areas Total or corporate Consolidated
Net sales:
Outside customers ¥ 894,469 ¥566,040 ¥ 479,891 ¥223,549 ¥2,163,949 ¥ — ¥2,163,949
Inter-segment 972,776 6,010 8,794 1,687 989,267 (989,267) —
Total 1,867,245 572,050 488,685 225,236 3,153,216 (989,267) 2,163,949
Costs and expenses 1,836,457 591,353 485,180 219,859 3,132,849 (978,358) 2,154,491
Operating income/(loss) ¥ 30,788 ¥ (19,303) ¥ 3,505 ¥ 5,377 ¥ 20,367 ¥ (10,909) ¥ 9,458
Total identifiable assets ¥1,825,170 ¥171,053 ¥ 221,094 ¥ 61,724 ¥2,279,041 ¥(331,272) ¥1,947,769
Millions of yen
For the year ended North Elimination
March 31, 2009 Japan America Europe Other areas Total or corporate Consolidated
Net sales:
Outside customers ¥ 988,829 ¥677,348 ¥640,904 ¥228,821 ¥2,535,902 ¥ — ¥2,535,902
Inter-segment 1,056,562 7,426 11,552 2,242 1,077,782 (1,077,782) —
Total 2,045,391 684,774 652,456 231,063 3,613,684 (1,077,782) 2,535,902
Costs and expenses 2,140,405 659,286 643,856 221,357 3,664,904 (1,100,621) 2,564,283
Operating (loss)/income ¥ (95,014) ¥ 25,488 ¥ 8,600 ¥ 9,706 ¥ (51,220) ¥ 22,839 ¥ (28,381)
Total identifiable assets ¥1,607,364 ¥186,263 ¥197,624 ¥ 57,641 ¥2,048,892 ¥ (247,911) ¥1,800,981