Mazda 2010 Annual Report Download - page 4
Download and view the complete annual report
Please find page 4 of the 2010 Mazda annual report below. You can navigate through the pages in the report by either clicking on the pages listed below, or by using the keyword search tool below to find specific information within the annual report.-
 1
1 -
 2
2 -
 3
3 -
 4
4 -
 5
5 -
 6
6 -
 7
7 -
 8
8 -
 9
9 -
 10
10 -
 11
11 -
 12
12 -
 13
13 -
 14
14 -
 15
15 -
16
-
17
-
18
-
19
-
20
-
21
-
22
-
23
-
24
-
25
-
26
-
27
-
28
-
29
-
30
-
31
-
32
-
33
-
34
-
35
-
36
-
37
-
38
-
39
-
40
-
41
-
42
-
43
-
44
-
45
-
46
-
47
-
48
-
49
-
50
-
51
-
52
-
53
-
54
-
55
-
56
-
57
-
58
-
59
-
60
-
61
-
62
-
63
-
64
-
65
-
66
-
67
-
68
-
69
-
70
-
71
-
72
-
73
-
74
-
75
-
76
-
77
-
78
 |
 |
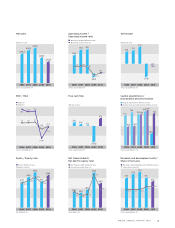
2
¥$
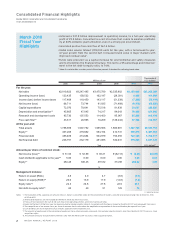
Thousands of
Millions of yen U.S. dollars
2006 2007 2008 2009 2010 2010
For the year:
Net sales ¥2,919,823 ¥3,247,485 ¥3,475,789 ¥2,535,902 ¥2,163,949 $23,268,269
Operating income (loss) 123,435 158,532 162,147 (28,381) 9,458 101,699
Income (loss) before income taxes 117,468 118,450 143,117 (51,339) (7,265) (78,118)
Net income (loss) 66,711 73,744 91,835 (71,489) (6,478) (69,656)
Capital expenditures 72,070 79,641 75,518 81,838 29,837 320,828
Depreciation and amortization*2 45,805 47,045 74,217 84,043 76,428 821,806
Research and development costs 95,730 107,553 114,400 95,967 85,206 916,194
Free cash flow*3 33,611 20,995 10,209 (129,244) 67,394 724,667
At the year-end:
Total assets 1,788,659 1,907,752 1,985,566 1,800,981 1,947,769 20,943,753
Equity*4 407,208 479,882 554,154 414,731 509,815 5,481,882
Financial debt 455,409 474,684 504,979 753,355 722,128 7,764,817
Net financial debt 246,751 232,179 281,085 532,631 375,825 4,041,129
Yen U.S. dollars*1
Amounts per share of common stock:
Net income (loss)*5 ¥51.53 ¥ 52.59 ¥ 65.21 ¥ (52.13) ¥ (4.26) $(0.05)
Cash dividends applicable to the year*6 5.00 6.00 6.00 3.00 3.00 0.03
Equity*7 284.28 336.45 391.82 314.98 286.92 3.09
%
Management indexes:
Return on asset (ROA) 3.8 4.0 4.7 (3.8) (0.3)
Return on equity (ROE)*8 20.0 16.9 17.9 (14.8) (1.4)
Equity ratio*8 22.3 24.8 27.8 22.9 26.1
Net debt-to-equity ratio*8 62 49 51 129 74
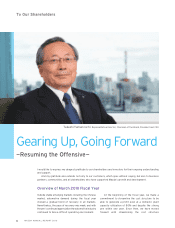
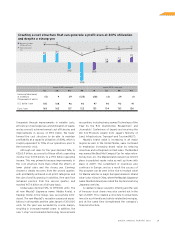
• Achieved a ¥37.8 billion improvement in operating income, to a full-year operating
prot of ¥9.5 billion. Converted to a cost structure that is able to maintain protabil-
ity at 80% domestic plant utilization, even in a strong yen environment.
• Generated positive free cash ow of ¥67.4 billion.
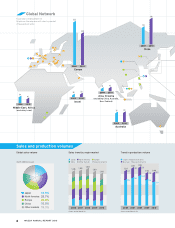
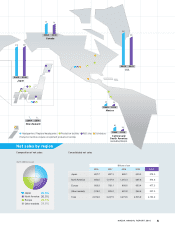
• Global sales volume totaled 1,193,000 units for the year, with a turnaround to year-
on-year growth from the second half. Increased brand value in major markets with
improved residual value*.
• Funds were procured via a capital increase for environmental and safety measures
and to strengthen the nancial structure. This led to a 55 percentage point improve-
ment in the net debt-to-equity ratio, to 74%.
* Value of a vehicle after a certain period of time has passed. A standard for indicating brand value.