Mazda 2010 Annual Report Download - page 43
Download and view the complete annual report
Please find page 43 of the 2010 Mazda annual report below. You can navigate through the pages in the report by either clicking on the pages listed below, or by using the keyword search tool below to find specific information within the annual report.-
 1
1 -
2
-
3
-
4
-
5
-
6
-
7
-
8
-
9
-
10
-
11
-
12
-
13
-
14
-
15
-
16
-
17
-
18
-
19
-
20
-
21
-
22
-
23
-
24
-
25
-
26
-
27
-
28
-
29
-
30
-
31
-
32
-
 33
33 -
 34
34 -
 35
35 -
 36
36 -
 37
37 -
 38
38 -
 39
39 -
 40
40 -
 41
41 -
 42
42 -
 43
43 -
 44
44 -
 45
45 -
 46
46 -
 47
47 -
 48
48 -
 49
49 -
 50
50 -
 51
51 -
 52
52 -
 53
53 -
54
-
55
-
56
-
57
-
58
-
59
-
60
-
61
-
62
-
63
-
64
-
65
-
66
-
67
-
68
-
69
-
70
-
71
-
72
-
73
-
74
-
75
-
76
-
77
-
78
 |
 |

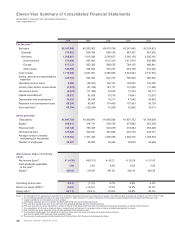
The consolidated financial statements for the March 2010
fiscal year include the accounts of Mazda Motor
Corporation, 52 consolidated subsidiaries (26 overseas and
26 in Japan) and 14 equity-method affiliates (5 overseas
and 9 in Japan).
The economic environment in which the Mazda Group
operated emerged from its lows during the March 2010
fiscal year, the result of economic measures put in place by
governments around the world in the wake of the economic
recession triggered by the financial crisis in the United
States. Although automotive demand outside strong
emerging markets like China showed a trend of gradual
recovery, it did not constitute a full-fledged rebound, and
with the yen’s continued appreciation the difficult operating
environment continued. Compared with the prior year, the
size of the domestic automobile industry grew 4%, to 4.88
million units. Total demand in the United States fell 9%, to
10.77 million units, and in Europe, including Russia, total
demand was down 5%, at 18.03 million units. The Chinese
market grew 65%, to 15.58 million units.
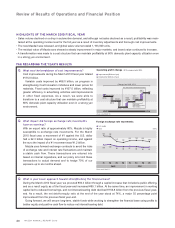
Against the backdrop of a continued difficult business envi-
ronment, Mazda made steady progress in implementing
measures to improve earnings. Adjustments of inventories
to appropriate levels were completed during the first quarter,
while at the same time cost improvement activities were
accelerated, and measures were strengthened to convert to
a streamlined and lean management structure, with fixed
cost reductions in excess of ¥100.0 billion. As a result, we
were able to achieve the transformation to a cost structure
that is able to maintain profitability at 80% domestic plant
capacity utilization in a strong yen environment.
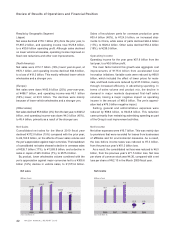
With a decline in global sales and the yen’s appreciation
against major currencies, Mazda’s consolidated results
showed a decline in revenue, but with a turnaround to a full-
year operating profit as the result of a range of measures to
improve costs. Although a net loss was recorded for the full
year, profitability was achieved and the amount of profit
grew in all profit categories from the second quarter as
earnings showed a steady recovery.
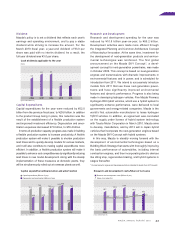
In terms of sales volumes for the year in major markets, a
1% increase year-over-year, to 221,000 units, was recorded
in Japan from the introduction of the new Mazda Axela,
despite a decline in sales of existing models. North
American sales were down 12%, at 307,000 units. Sales in
Europe were 26% lower, at 239,000 units, primarily from a
decline in Russia. Large growth was recorded in China, with
a 46% increase in sales, to 196,000 units, driven by the
Mazda6 (Japanese name: Mazda Atenza). Other markets
saw a 4% decline, to 230,000 units. In total, global sales
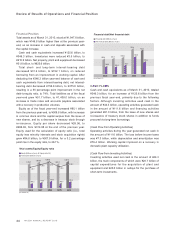
were down 5%, at 1,193,000 units. Consolidated whole-
sales for the year were 14% lower, at 963,000 units.
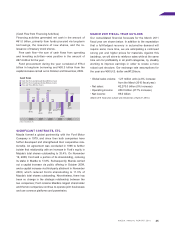
(28.0)
20.5
5.9
68
85
85
82
11.1
Operating income (Billions of yen)
Domestic plant utilization (%)
(H )H *H +H
(Year ended March 31, 2010)
Fg\iXk`e^`eZfd\&;fd\jk`ZgcXeklk`c`qXk`fe
1,276
1,363
1,261 1,193
1,302
(Thousands of units)
)''- )''. )''/ )''0 )'('
(Years ended March 31)
>cfYXcjXc\jmfcld\
859
1,149 1,177 1,240
1,116
963
913 983
290 264 257
896
220
744
219
Domestic (Thousands of units)
Overseas (Thousands of units)
)''- )''. )''/ )''0 )'('
(Years ended March 31)
:fejfc`[Xk\[n_fc\jXc\j
41