Mazda 2010 Annual Report Download - page 54
Download and view the complete annual report
Please find page 54 of the 2010 Mazda annual report below. You can navigate through the pages in the report by either clicking on the pages listed below, or by using the keyword search tool below to find specific information within the annual report.-
 1
1 -
2
-
3
-
4
-
5
-
6
-
7
-
8
-
9
-
10
-
11
-
12
-
13
-
14
-
15
-
16
-
17
-
18
-
19
-
20
-
21
-
22
-
23
-
24
-
25
-
26
-
27
-
28
-
29
-
30
-
31
-
32
-
33
-
34
-
35
-
36
-
37
-
38
-
39
-
40
-
41
-
42
-
43
-
 44
44 -
 45
45 -
 46
46 -
 47
47 -
 48
48 -
 49
49 -
 50
50 -
 51
51 -
 52
52 -
 53
53 -
 54
54 -
 55
55 -
 56
56 -
 57
57 -
 58
58 -
 59
59 -
 60
60 -
 61
61 -
 62
62 -
 63
63 -
 64
64 -
65
-
66
-
67
-
68
-
69
-
70
-
71
-
72
-
73
-
74
-
75
-
76
-
77
-
78
 |
 |
52
Thousands of
U.S. dollars
Millions of yen (Note 1)
2010 2009 2010
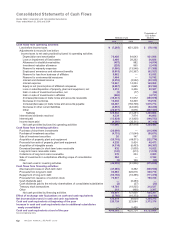
Cash flows from operating activities:
Loss before income taxes ¥ (7,265) ¥(51,339) $ (78,118)
Adjustments to reconcile loss before
income taxes to net cash provided by/(used in) operating activities:
Depreciation and amortization 76,428 84,043 821,806
Loss on impairment of fixed assets 2,495 28,262 26,828
Allowance for doubtful receivables (457) 882 (4,914)
Investment valuation allowance (225) 965 (2,419)
Reserve for warranty expenses (1,060) (13,546) (11,398)
Employees’ severance and retirement benefits (5,815) (10,367) (62,527)
Reserve for loss from business of affiliates 5,862 — 63,032
Reserve for environmental measures 1,464 — 15,742
Interest and dividend income (2,076) (3,552) (22,323)
Interest expense 13,947 14,224 149,968
Equity in net (income)/loss of affiliated companies (8,667) 2,665 (93,194)
Loss on sale/disposition of property, plant and equipment, net 3,012 2,456 32,387
Gain on sale of investment securities, net (3) (77) (32)
Gain on sale of investments in affiliates (440) — (4,731)
(Increase)/decrease in trade notes and accounts receivable (35,431) 51,972 (380,978)
Decrease in inventories 16,230 54,309 174,516
Increase/(decrease) in trade notes and accounts payable 94,467 (158,708) 1,015,774
Decrease in other current liabilities (4,857) (42,046) (52,226)
Other (22,077) 8,576 (237,387)
Subtotal 125,532 (31,281) 1,349,806
Interest and dividends received 4,334 7,974 46,602
Interest paid (13,834) (13,800) (148,753)
Income taxes paid (4,386) (30,311) (47,160)
Net cash provided by/(used in) operating activities 111,646 (67,418) 1,200,495
Cash flows from investing activities:
Purchase of short-term investments (20,000) — (215,054)
Purchase of investment securities (4,731) (11,044) (50,871)
Sale of investment securities 20 147 215
Acquisition of property, plant and equipment (20,718) (49,011) (222,774)
Proceeds from sale of property, plant and equipment 4,229 5,424 45,473
Acquisition of intangible assets (4,314) (6,463) (46,387)
Decrease/(increase) in short-term loans receivable 932 (1,008) 10,022
Long-term loans receivable made (141) (213) (1,516)
Collections of long-term loans receivable 270 234 2,903
Sale of investments in subsidiaries affecting scope of consolidation 204 — 2,194
Other (3) 108 (33)
Net cash used in investing activities (44,252) (61,826) (475,828)
Cash flows from financing activities:
(Decrease)/increase in short-term debt (47,389) 8,492 (509,559)
Proceeds from long-term debt 80,883 228,816 869,710
Repayment of long-term debt (66,158) (72,355) (711,376)
Proceeds from issuance of common stock 73,537 — 790,720
Cash dividends paid — (8,453) —
Cash dividends paid to the minority shareholders of consolidated subsidiaries (2) (27) (22)
Treasury stock transactions 19,765 (18,505) 212,527
Other 315 (960) 3,387
Net cash provided by financing activities 60,951 137,008 655,387
Effect of exchange rate fluctuations on cash and cash equivalents (2,766) (16,372) (29,742)
Net increase/(decrease) in cash and cash equivalents 125,579 (8,608) 1,350,312
Cash and cash equivalents at beginning of the year 220,724 223,894 2,373,376
Increase in cash and cash equivalents due to additional subsidiaries
newly consolidated — 5,438 —
Cash and cash equivalents at end of the year ¥346,303 ¥220,724 $3,723,688
See accompanying notes.