Macy's 2015 Annual Report Download - page 99
Download and view the complete annual report
Please find page 99 of the 2015 Macy's annual report below. You can navigate through the pages in the report by either clicking on the pages listed below, or by using the keyword search tool below to find specific information within the annual report.-
 1
1 -
2
-
3
-
4
-
5
-
6
-
7
-
8
-
9
-
10
-
11
-
12
-
13
-
14
-
15
-
16
-
17
-
18
-
19
-
20
-
21
-
22
-
23
-
24
-
25
-
26
-
27
-
28
-
29
-
30
-
31
-
32
-
33
-
34
-
35
-
36
-
37
-
38
-
39
-
40
-
41
-
42
-
43
-
44
-
45
-
46
-
47
-
48
-
49
-
50
-
51
-
52
-
53
-
54
-
55
-
56
-
57
-
58
-
59
-
60
-
61
-
62
-
63
-
64
-
65
-
66
-
67
-
68
-
69
-
70
-
71
-
72
-
73
-
74
-
75
-
76
-
77
-
78
-
79
-
80
-
81
-
82
-
83
-
84
-
85
-
86
-
87
-
88
-
 89
89 -
 90
90 -
 91
91 -
 92
92 -
 93
93 -
 94
94 -
 95
95 -
 96
96 -
 97
97 -
 98
98 -
 99
99 -
 100
100 -
 101
101 -
 102
102 -
 103
103 -
 104
104 -
 105
105 -
 106
106 -
 107
107 -
 108
108
 |
 |

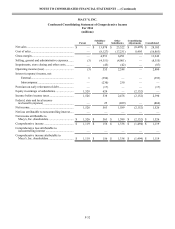
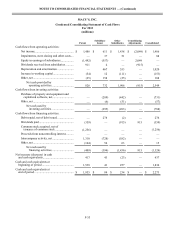
NOTES TO CONSOLIDATED FINANCIAL STATEMENTS — (Continued)
F-50
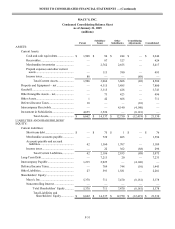
MACY’S, INC.
Condensed Consolidating Statement of Cash Flows
For 2015
(millions)
Parent
Subsidiary
Issuer
Other
Subsidiaries
Consolidating
Adjustments Consolidated
Cash flows from operating activities:
Net income....................................................... $ 1,072 $ 89 $ 1,402 $ (1,493) $ 1,070
Impairments, store closing and other costs...... — 170 118 — 288
Equity in earnings of subsidiaries.................... (1,072) (421) — 1,493 —
Dividends received from subsidiaries.............. 1,086 — — (1,086) —
Depreciation and amortization......................... — 440 621 — 1,061
(Increase) decrease in working capital............. 25 (340)(81) — (396)
Other, net.......................................................... (8) (78) 47 — (39)
Net cash provided (used) by
operating activities ................................ 1,103 (140) 2,107 (1,086) 1,984
Cash flows from investing activities:
Purchase of property and equipment and
capitalized software, net............................... —(88)(821) — (909)
Other, net.......................................................... — 83 (266) — (183)
Net cash used by investing activities ........ —(5)(1,087) — (1,092)
Cash flows from financing activities:
Debt issued, net of debt repaid......................... — 348 (1) — 347
Dividends paid ................................................. (456) — (1,086) 1,086 (456)
Common stock acquired, net of
issuance of common stock............................ (1,838) — — — (1,838)
Proceeds from noncontrolling interest............. — — 5 — 5
Intercompany activity, net................................ 12 (243) 231 — —
Other, net.......................................................... 12 37 (136) — (87)
Net cash provided (used) by
financing activities ............................... (2,270) 142 (987) 1,086 (2,029)
Net increase (decrease) in cash
and cash equivalents.......................................... (1,167) (3) 33 — (1,137)
Cash and cash equivalents at
beginning of period ........................................... 1,908 94 244 — 2,246
Cash and cash equivalents at
end of period ..................................................... $ 741 $ 91 $ 277 $ — $ 1,109