Macy's 2015 Annual Report Download - page 29
Download and view the complete annual report
Please find page 29 of the 2015 Macy's annual report below. You can navigate through the pages in the report by either clicking on the pages listed below, or by using the keyword search tool below to find specific information within the annual report.-
 1
1 -
2
-
3
-
4
-
5
-
6
-
7
-
8
-
9
-
10
-
11
-
12
-
13
-
14
-
15
-
16
-
17
-
18
-
 19
19 -
 20
20 -
 21
21 -
 22
22 -
 23
23 -
 24
24 -
 25
25 -
 26
26 -
 27
27 -
 28
28 -
 29
29 -
 30
30 -
 31
31 -
 32
32 -
 33
33 -
 34
34 -
 35
35 -
 36
36 -
 37
37 -
 38
38 -
 39
39 -
40
-
41
-
42
-
43
-
44
-
45
-
46
-
47
-
48
-
49
-
50
-
51
-
52
-
53
-
54
-
55
-
56
-
57
-
58
-
59
-
60
-
61
-
62
-
63
-
64
-
65
-
66
-
67
-
68
-
69
-
70
-
71
-
72
-
73
-
74
-
75
-
76
-
77
-
78
-
79
-
80
-
81
-
82
-
83
-
84
-
85
-
86
-
87
-
88
-
89
-
90
-
91
-
92
-
93
-
94
-
95
-
96
-
97
-
98
-
99
-
100
-
101
-
102
-
103
-
104
-
105
-
106
-
107
-
108
 |
 |

24
Net Interest Expense
Net interest expense for 2015 decreased $32 million from 2014. Net interest expense for 2015 benefited from lower
rates on outstanding borrowings as compared to 2014 and from the recognition of unamortized debt premium associated
with the $76 million of 8.125% senior debentures due 2035 which were redeemed at par on August 17, 2015, pursuant to
the terms of the debentures.
Premium on Early Retirement of Debt
On November 14, 2014, the Company provided a notice of redemption related to all of the $407 million of 7.875%
senior notes due 2015, as allowed under the terms of the indenture. The price for the redemption was calculated pursuant to
the indenture and resulted in the recognition of additional interest expense of $17 million during 2014. The additional
interest expense resulting from this transaction is presented as premium on early retirement of debt on the Consolidated
Statements of Income.
Effective Tax Rate
The Company's effective tax rate of 36.2% for 2015 and 2014 differ from the federal income tax statutory rate of
35%, and on a comparative basis, principally because of the effect of state and local income taxes, including the settlement
of various tax issues and tax examinations. Additionally, income tax expense for 2015 and 2014 benefited from historic
rehabilitation tax credits.
Comparison of 2014 and 2013
Net Income Attributable to Macy's, Inc. Shareholders
Net income attributable to Macy's, Inc. shareholders for 2014 increased compared to 2013, reflecting the benefits of
the key strategies at Macy's and Bloomingdale's as well as lower retirement expenses, higher income from credit operations
and gains on the sale of certain store locations and surplus properties, partially offset by greater investments in the
Company's omnichannel operations and higher depreciation and amortization expense.
Net Sales
Net sales for 2014 increased $174 million or 0.6% compared to 2013. The increase in comparable sales on an owned
basis for 2014 was 0.7% compared to 2013. The increase in comparable sales on an owned plus licensed basis for 2014 was
1.4% compared to 2013. (See page 18 for information regarding the Company's calculation of comparable sales, a
reconciliation of the non-GAAP measure which takes into account sales of departments licensed to third parties to the most
comparable GAAP measure and other important information). The Company continued to benefit from the successful
execution of the My Macy's localization, Omnichannel and Magic Selling strategies. Geographically, sales in 2014 were
strongest in the southern regions. By family of business, sales in 2014 were strongest in handbags, active and millennial
apparel, furniture and mattresses. Sales in 2014 were less strong in the housewares and tabletop businesses. Sales of the
Company's private label brands continued to be strong and represented approximately 20% of net sales in the Macy's-
branded operations in 2014.
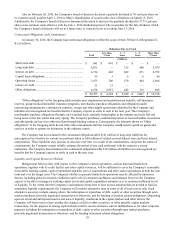
Cost of Sales
Cost of sales for 2014 increased $138 million from 2013. The cost of sales rate as a percent to net sales of 60.0% was
10 basis points higher in 2014, as compared to 59.9% in 2013, primarily due to continued growth of the omnichannel
businesses and the resulting impact of free shipping. The application of the last-in, first-out (LIFO) retail inventory method
did not result in the recognition of any LIFO charges or credits affecting cost of sales in either period.