Macy's 2015 Annual Report Download - page 30
Download and view the complete annual report
Please find page 30 of the 2015 Macy's annual report below. You can navigate through the pages in the report by either clicking on the pages listed below, or by using the keyword search tool below to find specific information within the annual report.-
 1
1 -
2
-
3
-
4
-
5
-
6
-
7
-
8
-
9
-
10
-
11
-
12
-
13
-
14
-
15
-
16
-
17
-
18
-
19
-
 20
20 -
 21
21 -
 22
22 -
 23
23 -
 24
24 -
 25
25 -
 26
26 -
 27
27 -
 28
28 -
 29
29 -
 30
30 -
 31
31 -
 32
32 -
 33
33 -
 34
34 -
 35
35 -
 36
36 -
 37
37 -
 38
38 -
 39
39 -
 40
40 -
41
-
42
-
43
-
44
-
45
-
46
-
47
-
48
-
49
-
50
-
51
-
52
-
53
-
54
-
55
-
56
-
57
-
58
-
59
-
60
-
61
-
62
-
63
-
64
-
65
-
66
-
67
-
68
-
69
-
70
-
71
-
72
-
73
-
74
-
75
-
76
-
77
-
78
-
79
-
80
-
81
-
82
-
83
-
84
-
85
-
86
-
87
-
88
-
89
-
90
-
91
-
92
-
93
-
94
-
95
-
96
-
97
-
98
-
99
-
100
-
101
-
102
-
103
-
104
-
105
-
106
-
107
-
108
 |
 |
25
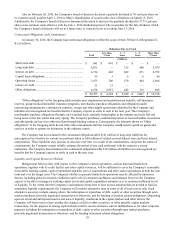
SG&A Expenses
SG&A expenses for 2014 decreased $85 million from 2013. The SG&A rate as a percent to net sales of 29.7% was
50 basis points lower in 2014, as compared to 2013. SG&A expenses in 2014 benefited from lower retirement expenses
(including Pension Plan, SERP and defined contribution plan expenses), higher income from credit operations, and gains
on the sale of certain store locations and surplus properties, partially offset by greater investments in the Company's
omnichannel operations and higher depreciation and amortization expense. Retirement expenses were $65 million in 2014
as compared to $235 million in 2013. Income from credit operations was $776 million in 2014 as compared to $731
million in 2013. SG&A expenses included gains on the sales of store locations and surplus properties of $92 million in
2014 as compared to $79 million in 2013. Depreciation and amortization expense was $1,036 million for 2014, compared
to $1,020 million for 2013. Advertising expense, net of cooperative advertising allowances, was $1,177 million for 2014
compared to $1,166 million for 2013. Advertising expense, net of cooperative advertising allowances, as a percent to net
sales was 4.2% for both 2014 and 2013.
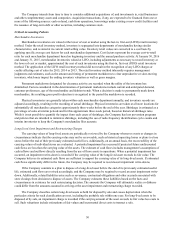
Impairments, Store Closing and Other Costs
Impairments, store closing and other costs for 2014 included costs and expenses primarily associated with
organization changes and store closings announced in January 2015. During 2014, these costs and expenses included $46
million of severance and other human resource-related costs and asset impairment charges of $33 million. Impairments,
store closing and other costs for 2013 included costs and expenses primarily associated with cost-reduction initiatives and
store closings announced in January 2014. During 2013, these costs and expenses included $43 million of severance and
other human resource-related costs and asset impairment charges of $39 million.
Net Interest Expense
Net interest expense for 2014 increased $5 million from 2013. The increase in net interest expense for 2014 was due
to higher levels of average outstanding borrowings as compared to 2013.
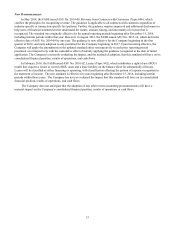
Premium on Early Retirement of Debt
On November 14, 2014, the Company provided a notice of redemption related to all of the $407 million of 7.875%
senior notes due 2015, as allowed under the terms of the indenture. The price for the redemption was calculated pursuant to
the indenture and resulted in the recognition of additional interest expense of $17 million during 2014. The additional
interest expense resulting from this transaction is presented as premium on early retirement of debt on the Consolidated
Statements of Income.
Effective Tax Rate
The Company's effective tax rate of 36.2% for 2014 and 35.1% for 2013 differ from the federal income tax statutory
rate of 35%, and on a comparative basis, principally because of the effect of state and local income taxes, including the
settlement of various tax issues and tax examinations. Additionally, income tax expense for both 2014 and 2013 benefited
from historic rehabilitation tax credits and 2013 also benefited from a reduction in the valuation allowance related
primarily to state net operating loss carryforwards.