Macy's 2015 Annual Report Download - page 28
Download and view the complete annual report
Please find page 28 of the 2015 Macy's annual report below. You can navigate through the pages in the report by either clicking on the pages listed below, or by using the keyword search tool below to find specific information within the annual report.-
 1
1 -
2
-
3
-
4
-
5
-
6
-
7
-
8
-
9
-
10
-
11
-
12
-
13
-
14
-
15
-
16
-
17
-
 18
18 -
 19
19 -
 20
20 -
 21
21 -
 22
22 -
 23
23 -
 24
24 -
 25
25 -
 26
26 -
 27
27 -
 28
28 -
 29
29 -
 30
30 -
 31
31 -
 32
32 -
 33
33 -
 34
34 -
 35
35 -
 36
36 -
 37
37 -
 38
38 -
39
-
40
-
41
-
42
-
43
-
44
-
45
-
46
-
47
-
48
-
49
-
50
-
51
-
52
-
53
-
54
-
55
-
56
-
57
-
58
-
59
-
60
-
61
-
62
-
63
-
64
-
65
-
66
-
67
-
68
-
69
-
70
-
71
-
72
-
73
-
74
-
75
-
76
-
77
-
78
-
79
-
80
-
81
-
82
-
83
-
84
-
85
-
86
-
87
-
88
-
89
-
90
-
91
-
92
-
93
-
94
-
95
-
96
-
97
-
98
-
99
-
100
-
101
-
102
-
103
-
104
-
105
-
106
-
107
-
108
 |
 |

23
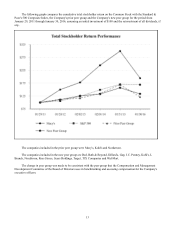
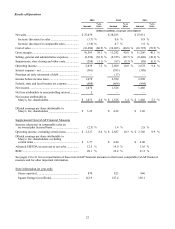
Comparison of 2015 and 2014
Net Income Attributable to Macy's, Inc. Shareholders
Net income attributable to Macy's, Inc. shareholders for 2015 decreased compared to 2014, reflecting lower sales and
gross margin and higher impairments, store closing costs and other costs, partially offset by lower selling, general and
administrative expenses, interest expense and income taxes in 2015 as compared to 2014.
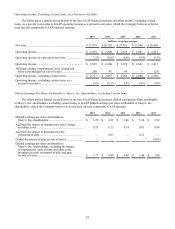
Net Sales
Net sales for 2015 decreased $1,026 million or 3.7% compared to 2014. The decrease in comparable sales on an
owned basis for 2015 was 3.0% compared to 2014. The decrease in comparable sales on an owned plus licensed basis for
2015 was 2.5% compared to 2014. (See page 18 for information regarding the Company's calculation of comparable sales,
a reconciliation of the non-GAAP measure which takes into account sales of departments licensed to third parties to the
most comparable GAAP measure and other important information). The Company experienced an overall weakness in
sales, but geographically sales in 2015 were stronger in the western and southern regions, where weather was less of a
factor, while sales at locations that are frequented by international tourists, such as New York City, Las Vegas, San
Francisco and Chicago were negatively impacted by lower levels of spending by these tourists. Digital sales growth
continued strong in 2015. By family of business, sales in 2015 were strongest in active apparel, cosmetics and fragrances
and furniture and mattresses. Sales in 2015 were less strong in fashion watches, cold weather items, and the housewares
and tabletop businesses. Sales of the Company's private label brands represented approximately 20% of net sales in the
Macy's-branded operations in 2015.
Cost of Sales
Cost of sales for 2015 decreased $367 million from 2014. The cost of sales rate as a percent to net sales of 60.9%
was 90 basis points higher in 2015, as compared to 60.0% in 2014, primarily due to higher markdowns resulting from the
need to clear inventory based on the weaker sales trend as well as the continued growth of the omnichannel businesses and
the resulting impact of free shipping. The application of the last-in, first-out (LIFO) retail inventory method did not result
in the recognition of any LIFO charges or credits affecting cost of sales in either period.
SG&A Expenses
SG&A expenses for 2015 decreased $99 million from 2014, however the SG&A rate as a percent to net sales of
30.5% was 80 basis points higher in 2015, as compared to 2014. SG&A expenses in 2015 benefited from higher income
from credit operations and higher gains on the sale of certain store locations and surplus properties, partially offset by
higher retirement expenses (including Pension Plan, SERP and defined contribution plan expenses), higher expenses
associated with the continued investments in the Company's omnichannel operations, investments in Bluemercury, Macy's
Backstage and Macy's China Limited and higher depreciation and amortization expense. Income from credit operations
was $831 million in 2015 as compared to $776 million in 2014. SG&A expenses included gains on the sales of certain store
locations and surplus properties of $212 million in 2015 compared to $92 million in 2014. Included in the gains on the
sales of store locations and surplus properties in 2015 was $84 million related to the sale of Brooklyn real estate and $57
million related to the downtown Seattle real estate transaction. Retirement expenses were $77 million in 2015 as compared
to $65 million in 2014. Depreciation and amortization expense was $1,061 million for 2015, compared to $1,036 million
for 2014. Advertising expense, net of cooperative advertising allowances, was $1,173 million for 2015 compared to $1,177
million for 2014. Advertising expense, net of cooperative advertising allowances, as a percent to net sales was 4.3% for
2015 and 4.2% for 2014.
Impairments, Store Closing and Other Costs
Impairments, store closing and other costs for 2015 includes costs and expenses primarily associated with the cost
efficiency initiatives and store closings announced in January 2016. During 2015, these costs and expenses included $123
million of severance and other human resource-related costs and asset impairment charges of $148 million. Impairments,
store closing and other costs for 2014 included costs and expenses primarily associated with organization changes and store
closings announced in January 2015. During 2014, these costs and expenses included $46 million of severance and other
human resource-related costs and asset impairment charges of $33 million.