Macy's 2013 Annual Report Download - page 97
Download and view the complete annual report
Please find page 97 of the 2013 Macy's annual report below. You can navigate through the pages in the report by either clicking on the pages listed below, or by using the keyword search tool below to find specific information within the annual report.-
 1
1 -
2
-
3
-
4
-
5
-
6
-
7
-
8
-
9
-
10
-
11
-
12
-
13
-
14
-
15
-
16
-
17
-
18
-
19
-
20
-
21
-
22
-
23
-
24
-
25
-
26
-
27
-
28
-
29
-
30
-
31
-
32
-
33
-
34
-
35
-
36
-
37
-
38
-
39
-
40
-
41
-
42
-
43
-
44
-
45
-
46
-
47
-
48
-
49
-
50
-
51
-
52
-
53
-
54
-
55
-
56
-
57
-
58
-
59
-
60
-
61
-
62
-
63
-
64
-
65
-
66
-
67
-
68
-
69
-
70
-
71
-
72
-
73
-
74
-
75
-
76
-
77
-
78
-
79
-
80
-
81
-
82
-
83
-
84
-
85
-
86
-
 87
87 -
 88
88 -
 89
89 -
 90
90 -
 91
91 -
 92
92 -
 93
93 -
 94
94 -
 95
95 -
 96
96 -
 97
97 -
 98
98 -
 99
99 -
 100
100 -
 101
101 -
 102
102 -
 103
103 -
 104
104 -
 105
105 -
 106
106 -
 107
107 -
108
-
109
-
110
-
111
-
112
-
113
-
114
-
115
-
116
-
117
-
118
-
119
-
120
-
121
-
122
-
123
-
124
-
125
-
126
-
127
-
128
-
129
-
130
-
131
-
132
-
133
-
134
-
135
-
136
-
137
-
138
-
139
-
140
-
141
-
142
-
143
-
144
-
145
-
146
-
147
-
148
-
149
-
150
-
151
-
152
-
153
-
154
-
155
-
156
-
157
-
158
-
159
-
160
-
161
-
162
-
163
-
164
-
165
-
166
-
167
-
168
-
169
-
170
-
171
-
172
-
173
-
174
-
175
-
176
-
177
-
178
-
179
-
180
-
181
-
182
-
183
-
184
-
185
-
186
-
187
-
188
-
189
-
190
-
191
-
192
-
193
-
194
-
195
-
196
-
197
-
198
-
199
-
200
-
201
-
202
-
203
-
204
-
205
-
206
-
207
-
208
-
209
-
210
-
211
-
212
-
213
-
214
-
215
-
216
-
217
-
218
-
219
-
220
-
221
-
222
-
223
-
224
-
225
-
226
-
227
-
228
-
229
-
230
-
231
-
232
-
233
-
234
-
235
-
236
-
237
-
238
-
239
-
240
-
241
-
242
-
243
-
244
-
245
-
246
-
247
-
248
-
249
-
250
-
251
-
252
-
253
-
254
-
255
-
256
-
257
-
258
-
259
-
260
-
261
-
262
-
263
-
264
-
265
-
266
-
267
-
268
-
269
-
270
-
271
-
272
-
273
-
274
-
275
-
276
-
277
-
278
-
279
-
280
-
281
-
282
-
283
-
284
-
285
-
286
-
287
-
288
 |
 |
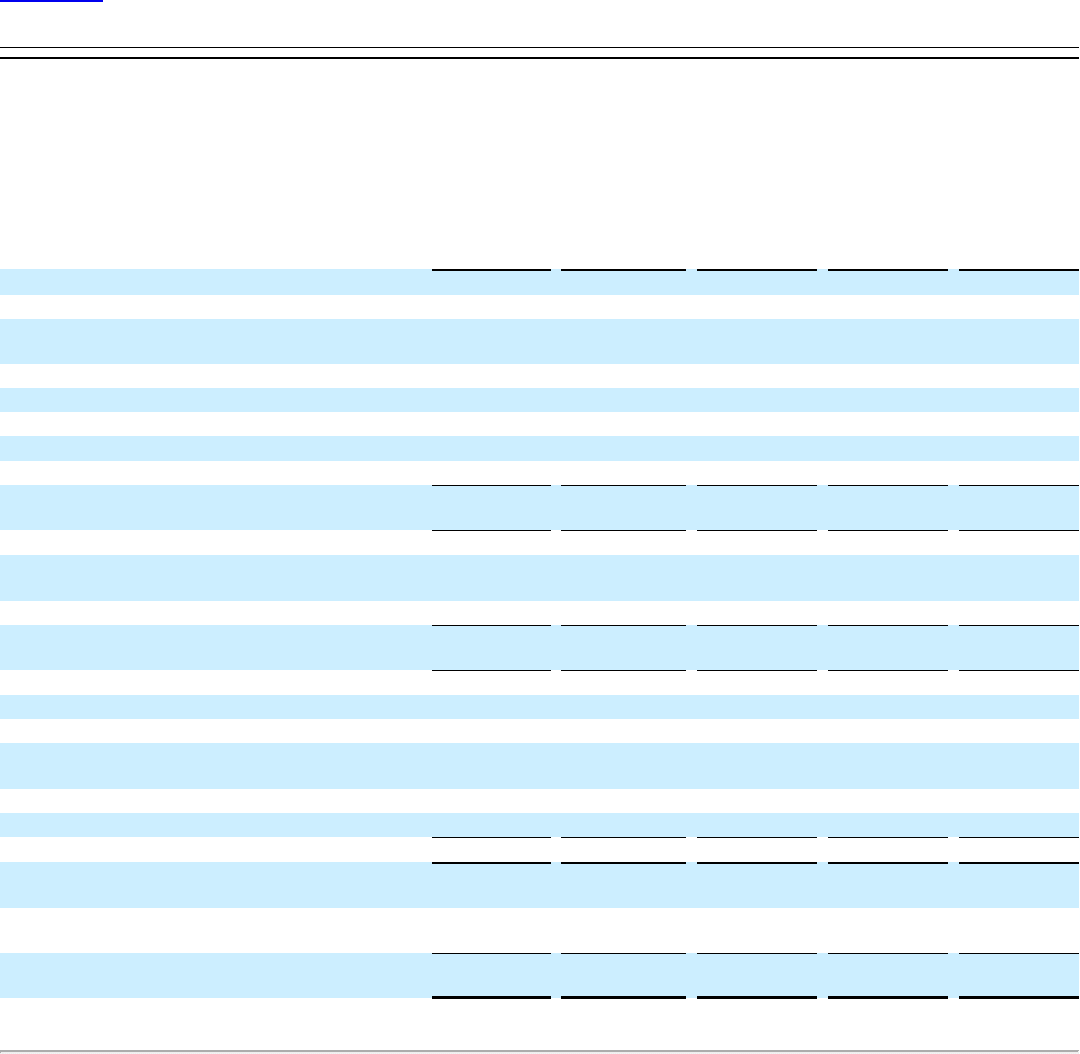
Table of Contents
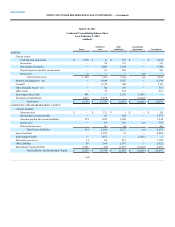
Cash flows from operating activities:
Net income $ 1,335
$ 574
$ 1,406
$ (1,980)
$ 1,335
Impairments, store closing and other costs
and gain on sale of leases —
8
(3)
—
5
Equity in earnings of subsidiaries (1,342)
(638)
—
1,980
—
Dividends received from subsidiaries 783
125
—
(908)
—
Depreciation and amortization —
484
565
—
1,049
Increase in working capital (76)
(75)
(66)
—
(217)
Other, net 31
(31)
7
—
7
Net cash provided by
operating activities 731
447
1,909
(908)
2,179
Cash flows from investing activities:
Purchase of property and equipment and capitalized
software, net —
(324)
(552)
—
(876)
Other, net —
51
44
—
95
Net cash used by
investing activities —
(273)
(508)
—
(781)
Cash flows from financing activities:
Debt repaid, net of debt issued —
(799)
(4)
—
(803)
Dividends paid (324)
—
(908)
908
(324)
Common stock acquired, net of
issuance of common stock (1,163)
—
—
—
(1,163)
Intercompany activity, net (194)
642
(448)
—
—
Other, net (45)
(14)
(40)
—
(99)
Net cash used by financing activities (1,726)
(171)
(1,400)
908
(2,389)
Net increase (decrease) in
cash and cash equivalents (995)
3
1
—
(991)
Cash and cash equivalents at
beginning of period 2,533
38
256
—
2,827
Cash and cash equivalents at
end of period $1,538
$41
$257
$ —
$1,836
F-51