Macy's 2013 Annual Report Download - page 27
Download and view the complete annual report
Please find page 27 of the 2013 Macy's annual report below. You can navigate through the pages in the report by either clicking on the pages listed below, or by using the keyword search tool below to find specific information within the annual report.-
 1
1 -
2
-
3
-
4
-
5
-
6
-
7
-
8
-
9
-
10
-
11
-
12
-
13
-
14
-
15
-
16
-
 17
17 -
 18
18 -
 19
19 -
 20
20 -
 21
21 -
 22
22 -
 23
23 -
 24
24 -
 25
25 -
 26
26 -
 27
27 -
 28
28 -
 29
29 -
 30
30 -
 31
31 -
 32
32 -
 33
33 -
 34
34 -
 35
35 -
 36
36 -
 37
37 -
38
-
39
-
40
-
41
-
42
-
43
-
44
-
45
-
46
-
47
-
48
-
49
-
50
-
51
-
52
-
53
-
54
-
55
-
56
-
57
-
58
-
59
-
60
-
61
-
62
-
63
-
64
-
65
-
66
-
67
-
68
-
69
-
70
-
71
-
72
-
73
-
74
-
75
-
76
-
77
-
78
-
79
-
80
-
81
-
82
-
83
-
84
-
85
-
86
-
87
-
88
-
89
-
90
-
91
-
92
-
93
-
94
-
95
-
96
-
97
-
98
-
99
-
100
-
101
-
102
-
103
-
104
-
105
-
106
-
107
-
108
-
109
-
110
-
111
-
112
-
113
-
114
-
115
-
116
-
117
-
118
-
119
-
120
-
121
-
122
-
123
-
124
-
125
-
126
-
127
-
128
-
129
-
130
-
131
-
132
-
133
-
134
-
135
-
136
-
137
-
138
-
139
-
140
-
141
-
142
-
143
-
144
-
145
-
146
-
147
-
148
-
149
-
150
-
151
-
152
-
153
-
154
-
155
-
156
-
157
-
158
-
159
-
160
-
161
-
162
-
163
-
164
-
165
-
166
-
167
-
168
-
169
-
170
-
171
-
172
-
173
-
174
-
175
-
176
-
177
-
178
-
179
-
180
-
181
-
182
-
183
-
184
-
185
-
186
-
187
-
188
-
189
-
190
-
191
-
192
-
193
-
194
-
195
-
196
-
197
-
198
-
199
-
200
-
201
-
202
-
203
-
204
-
205
-
206
-
207
-
208
-
209
-
210
-
211
-
212
-
213
-
214
-
215
-
216
-
217
-
218
-
219
-
220
-
221
-
222
-
223
-
224
-
225
-
226
-
227
-
228
-
229
-
230
-
231
-
232
-
233
-
234
-
235
-
236
-
237
-
238
-
239
-
240
-
241
-
242
-
243
-
244
-
245
-
246
-
247
-
248
-
249
-
250
-
251
-
252
-
253
-
254
-
255
-
256
-
257
-
258
-
259
-
260
-
261
-
262
-
263
-
264
-
265
-
266
-
267
-
268
-
269
-
270
-
271
-
272
-
273
-
274
-
275
-
276
-
277
-
278
-
279
-
280
-
281
-
282
-
283
-
284
-
285
-
286
-
287
-
288
 |
 |

Table of Contents
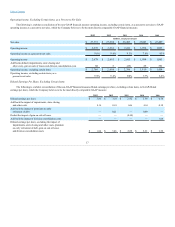
Premium on Early Retirement of Debt
On November 28, 2012, the Company repurchased $700 million aggregate principal amount of its outstanding senior unsecured notes, which had a net
book value of $706 million. The repurchased senior unsecured notes had stated interest rates ranging from 5.9% to 7.875% and maturities in 2015 and
2016. The Company recorded the redemption premium and other costs related to these repurchases as additional interest expense of $133 million in 2012. On
March 29, 2012, the Company redeemed the $173 million of 8.0% senior debentures due July 15, 2012, as allowed under the terms of the indenture. The
price for the redemption was calculated pursuant to the indenture and resulted in the recognition of additional interest expense of $4 million in 2012. The
additional interest expense resulting from these transactions is presented as premium on early retirement of debt on the Consolidated Statements of Income.
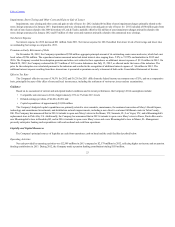
Effective Tax Rate
The Company's effective tax rate of 35.1% for 2013 and 36.5% for 2012 differ from the federal income tax statutory rate of 35%, and on a comparative
basis, principally because of the effect of state and local income taxes, including the settlement of various tax issues and tax examinations. Additionally,
income tax expense for 2013 benefited from historic rehabilitation tax credits and a reduction in the valuation allowance related primarily to state net operating
loss carryforwards.
Comparison of 2012 and 2011
Net Income
Net income for 2012 increased compared to 2011, reflecting the benefits of the key strategies at Macy's, the continued strong performance at
Bloomingdale's, higher income from credit operations, and the 53rd week in 2012.
Net Sales
Net sales for 2012, which had one additional week compared to 2011, increased $1,281 million or 4.9% compared to 2011. On a comparable basis, net
sales for 2012 were up 3.7% compared to 2011. Together with sales of departments licensed to third parties, 2012 sales on a comparable basis were up 4.0%.
(See page 16 for information regarding the Company's calculation of comparable sales, a reconciliation of the non-GAAP measure which takes into account
sales of departments licensed to third parties to the most comparable GAAP measure and other important information). The Company continued to benefit
from the successful execution of the My Macy's localization, Omnichannel and Magic Selling strategies. Geographically, sales in 2012 were strongest in the
southern regions as well as some markets in other parts of the country such as Western New York, Oregon and Colorado. By family of business, sales in
2012 were strongest in watches, handbags, cosmetics, textiles, furniture and mattresses. Sales in 2012 were less strong in juniors. Sales of the Company's
private label brands continued to be strong with particular growth coming from millennial, classic apparel and home textile brands. Sales of the Company's
private label brands represented approximately 20% of net sales in the Macy's-branded stores in 2012.
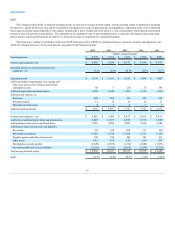
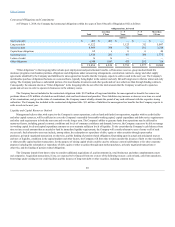
Cost of Sales
Cost of sales for 2012 increased $800 million from 2011. The cost of sales rate as a percent to net sales of 59.7% was 10 basis points higher in 2012,
as compared to 59.6% in 2011, primarily due to the growth of the omnichannel businesses and the resulting impact of free shipping. The application of the
last-in, first-out (LIFO) retail inventory method did not result in the recognition of any LIFO charges or credits affecting cost of sales in either period.
SG&A Expenses
SG&A expenses for 2012 increased $201 million from 2011. The SG&A rate as a percent to net sales of 30.7% was 70 basis points lower in 2012, as
compared to 2011, reflecting increased net sales. SG&A expenses in 2012 were impacted by higher selling costs as a result of stronger sales, higher retirement
expenses (including Pension Plan, SERP and 401(k) expenses), and greater investments in the Company's omnichannel operations, partially offset by higher
income from credit operations and lower depreciation and amortization expense. Retirement expenses were $232 million in 2012 as compared to $160 million
in 2011, primarily due to the lower discount rate. Advertising expense, net of cooperative advertising allowances, was $1,123 million for 2012 compared to
$1,060 million for 2011. Advertising expense, net of cooperative advertising allowances, as a percent to net sales was 4.3% for both 2012 and 2011. Income
from credit operations was $663 million in 2012 as compared to $582 million in 2011. Depreciation and amortization expense was $1,049 million for 2012,
compared to $1,085 million for 2011.
22