Macy's 2013 Annual Report Download - page 69
Download and view the complete annual report
Please find page 69 of the 2013 Macy's annual report below. You can navigate through the pages in the report by either clicking on the pages listed below, or by using the keyword search tool below to find specific information within the annual report.-
 1
1 -
2
-
3
-
4
-
5
-
6
-
7
-
8
-
9
-
10
-
11
-
12
-
13
-
14
-
15
-
16
-
17
-
18
-
19
-
20
-
21
-
22
-
23
-
24
-
25
-
26
-
27
-
28
-
29
-
30
-
31
-
32
-
33
-
34
-
35
-
36
-
37
-
38
-
39
-
40
-
41
-
42
-
43
-
44
-
45
-
46
-
47
-
48
-
49
-
50
-
51
-
52
-
53
-
54
-
55
-
56
-
57
-
58
-
 59
59 -
 60
60 -
 61
61 -
 62
62 -
 63
63 -
 64
64 -
 65
65 -
 66
66 -
 67
67 -
 68
68 -
 69
69 -
 70
70 -
 71
71 -
 72
72 -
 73
73 -
 74
74 -
 75
75 -
 76
76 -
 77
77 -
 78
78 -
 79
79 -
80
-
81
-
82
-
83
-
84
-
85
-
86
-
87
-
88
-
89
-
90
-
91
-
92
-
93
-
94
-
95
-
96
-
97
-
98
-
99
-
100
-
101
-
102
-
103
-
104
-
105
-
106
-
107
-
108
-
109
-
110
-
111
-
112
-
113
-
114
-
115
-
116
-
117
-
118
-
119
-
120
-
121
-
122
-
123
-
124
-
125
-
126
-
127
-
128
-
129
-
130
-
131
-
132
-
133
-
134
-
135
-
136
-
137
-
138
-
139
-
140
-
141
-
142
-
143
-
144
-
145
-
146
-
147
-
148
-
149
-
150
-
151
-
152
-
153
-
154
-
155
-
156
-
157
-
158
-
159
-
160
-
161
-
162
-
163
-
164
-
165
-
166
-
167
-
168
-
169
-
170
-
171
-
172
-
173
-
174
-
175
-
176
-
177
-
178
-
179
-
180
-
181
-
182
-
183
-
184
-
185
-
186
-
187
-
188
-
189
-
190
-
191
-
192
-
193
-
194
-
195
-
196
-
197
-
198
-
199
-
200
-
201
-
202
-
203
-
204
-
205
-
206
-
207
-
208
-
209
-
210
-
211
-
212
-
213
-
214
-
215
-
216
-
217
-
218
-
219
-
220
-
221
-
222
-
223
-
224
-
225
-
226
-
227
-
228
-
229
-
230
-
231
-
232
-
233
-
234
-
235
-
236
-
237
-
238
-
239
-
240
-
241
-
242
-
243
-
244
-
245
-
246
-
247
-
248
-
249
-
250
-
251
-
252
-
253
-
254
-
255
-
256
-
257
-
258
-
259
-
260
-
261
-
262
-
263
-
264
-
265
-
266
-
267
-
268
-
269
-
270
-
271
-
272
-
273
-
274
-
275
-
276
-
277
-
278
-
279
-
280
-
281
-
282
-
283
-
284
-
285
-
286
-
287
-
288
 |
 |

Table of Contents
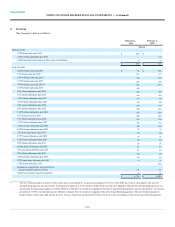
Expected tax $801
$ 736
$689
State and local income taxes, net of federal income tax benefit 45
47
34
Historic rehabilitation tax credit (16)
—
—
Change in valuation allowance (16)
(2)
(3)
Other (10)
(14)
(8)
$804
$767
$ 712
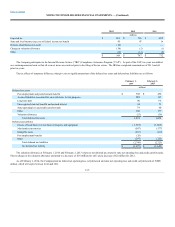
The Company participates in the Internal Revenue Service (“IRS”) Compliance Assurance Program ("CAP"). As part of the CAP, tax years are audited
on a contemporaneous basis so that all or most issues are resolved prior to the filing of the tax return. The IRS has completed examinations of 2011 and all
prior tax years.
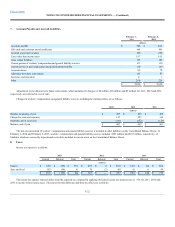
The tax effects of temporary differences that give rise to significant portions of the deferred tax assets and deferred tax liabilities are as follows:
Deferred tax assets
Post employment and postretirement benefits $ 392
$ 476
Accrued liabilities accounted for on a cash basis for tax purposes 289
237
Long-term debt 90
96
Unrecognized state tax benefits and accrued interest 84
71
State operating loss and credit carryforwards 79
60
Other 160
177
Valuation allowance (23)
(39)
Total deferred tax assets 1,071
1,078
Deferred tax liabilities
Excess of book basis over tax basis of property and equipment (1,569)
(1,665)
Merchandise inventories (587)
(577)
Intangible assets (263)
(230)
Post employment benefits (28)
—
Other (297)
(251)
Total deferred tax liabilities (2,744)
(2,723)
Net deferred tax liability $ (1,673)
$(1,645)
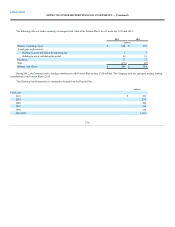
The valuation allowance at February 1, 2014 and February 2, 2013 relates to net deferred tax assets for state net operating loss and credit carryforwards.
The net change in the valuation allowance amounted to a decrease of $16 million for 2013 and a decrease of $2 million for 2012.
As of February 1, 2014, the Company had no federal net operating loss carryforwards and state net operating loss and credit carryforwards of $608
million, which will expire between 2014 and 2033.
F-23